1.Introduction
Healthcare disparities, or differences in the ways population groups access and receive healthcare, remain a significant problem in the US healthcare system. Although disparities-related research has increased over the last decade, this area still remains under-investigated within the medical literature, a problem that also extends into the field of neurosurgery.[1,2] In the US, hospitals typically operate according to one of two major models: public hospitals, which are funded by a public municipality, typically have more beds, and accept nearly every form of insurance; or private hospitals, which are owned privately (i.e. not by the government) and in which patients pay for medical care out-of-pocket or through private insurance.[3] These differences in structure and insurance acceptance mean that private and public hospitals often serve different patient populations, though the specific differences may vary depending on regional factors, such as rural versus urban setting.[4,5]
Due to their different sources of funding, public and private hospitals also often differ in management and available resources.[4] Differences in resource availability can profoundly impact patient care and hospital care efficiency.[3] Resource limitations can also be compounded by social determinants of health, leading to chronic strain on persistently under-resourced settings, an issue that became especially apparent during the COVID-19 pandemic.[5] As billing structures in medicine evolve, efficiency of care has become an important metric for practices across the nation.[1] Healthcare efficiency refers to achieving optimal health outcomes while minimizing resource waste.[6] This is crucial to control rising healthcare costs and to improve care quality.[6,7] While healthcare efficiency can be operationally defined and measured in many different ways, hospital length of stay (LOS) is one measure that can be used.[8] Higher LOS is associated with increased hospital costs and adverse patient outcomes, while lower LOS can reduce healthcare expenditures, increase the number of available beds for newly admitted patients, and allow for more efficient use of resources.[9—11] Neurosurgery is a particularly resource-intensive field requiring specialized equipment and imaging technology, highly skilled staff, and ongoing operational expenses.[12] For this reason, efficient allocation of surgical teams, technology, and follow-up care is essential for balancing costs and optimizing patient outcomes.[1] The extant literature is mostly written from the experience of premiere academic centers and does not necessarily reflect the community standard.[6] Furthermore, in order to understand disparities in efficiency of care, it can often be difficult to compare hospitals separated greatly by geography, patient population, and state legislation.
For these reasons, we have chosen to evaluate disparities in the efficiency of neurosurgical care in the microcosm of New York City (NYC). NYC has a small geographic catchment area, a highly diverse patient population, is a hub of neurosurgical care, being home to over 130 neurosurgeons.[9] Furthermore, NYC contains several academic powerhouses as well as one of the nation’s largest public health systems, NYC Health + Hospitals (NYCHHC). New York also provides public access to the Statewide Planning and Research Cooperative System (SPARCS) database, which collects patient-level data on each in-state hospital admission. We therefore sought to compare neurosurgical patient characteristics and demographics, neurosurgical case patterns, and LOS as a marker of efficiency of care between the private and public hospitals in NYC over the course of a decade.
2.Methods
2.1Database collection
We used the SPARCS database to perform a retrospective exploratory analysis of analyzed patients receiving neurosurgical care from 2009 to 2022 at the flagship hospitals of the NYC private academic health systems: NYU Langone Hospital, New York Presbyterian-Columbia (NYP-Columbia), New York Presbyterian-Cornell (NYP-Cornell), Northwell Lennox Hill, Mount Sinai Hospital; and the public NYC (NYCHHC) hospitals with neurosurgical care available: Bellevue Hospital, Harlem Hospital Center, Kings County Hospital, Elmhurst Hospital, Jacobi Medical Center, South Brooklyn Hospital, and Lincoln Medical & Mental Health Center.
SPARCS uses All Patient Refined Diagnosis-Related Group (APR-DRG) terms, a classification system that categorizes patients according to their reason for admission, illness severity, and mortality risk. We identified APR-DRG terms corresponding to neurosurgical etiologies (see Appendix Table 1) and sorted the data to include procedures at the above-mentioned private and public hospitals. Our patient cohort met three criteria: (1) included in the SPARCS database, (2) affiliated with one or more neurosurgical APR-DRG terms, and (3) treated at one of the NYC hospitals listed above.
2.2Grouping
Data were analyzed with hospitals divided into two cohorts: private academic institutions and public hospitals. When reviewing etiology types, APR-DRG codes were grouped as follows: (1) cranial except trauma, (2) cranial trauma, (3) shunt, (4) spinal except trauma, (5) spinal trauma, and (6) stroke. The specific grouping of APR-DRG terms is described in Appendix Table 2.
A subanalysis was done to compare a private Level 1 trauma center with a public Level 1 trauma center in Manhattan. The private trauma center was NYP-Cornell and the public trauma center was NYCHHC-Bellevue Hospital. Patient demographics, case distributions, and LOS, among other variables, were compared between the two hospitals using the above methods.
2.3Data analysis
SPARCS data for reported race, APR-DRG term(s), illness severity, risk of mortality, insurance type, case type, disposition, and LOS were compiled for each patient. Data were analyzed both cumulatively across the entire twelve-year period and stratified by year to capture trends in each of the measures from 2009 to 2022. All analyses were performed in Python. For the comparison of proportions, we used the Chi-square test with Bonferroni correction for multiple comparisons. For comparison of numerical means, a
Risk ratios (e.g., high-severity to low-severity ratio, high-mortality to low-mortality ratio) were calculated by comparing the proportions of patient groups in each category (e.g., number of high-severity cases divided by number of low-severity cases). This method was used to compare the incidence of specific clinical outcomes, such as LOS and mortality, between public and private hospitals, with adjustments for confounding factors where appropriate.
We also performed multivariate linear regression to assess the impact of demographic, clinical, and hospital factors on LOS. Interaction terms were included to test for synergistic effects between key variables, including illness severity, hospital type, age, etiology, and admission type.
3.Results
3.1Database overview
A total of 325,351 patients were identified to meet inclusion criteria across 2009-2022, 223,361 patients of whom belonged to the private hospital cohort and 101,990 of whom belonged to the public hospital cohort (see Figure 1). Patient race, gender, and age group are outlined in Table 1. Most notably, private hospitals had a much higher percentage of White patients at 51.5% compared with 14.2% in public hospitals and a lower percentage of Black patients at 11.6% compared with 44.9% in public hospitals (
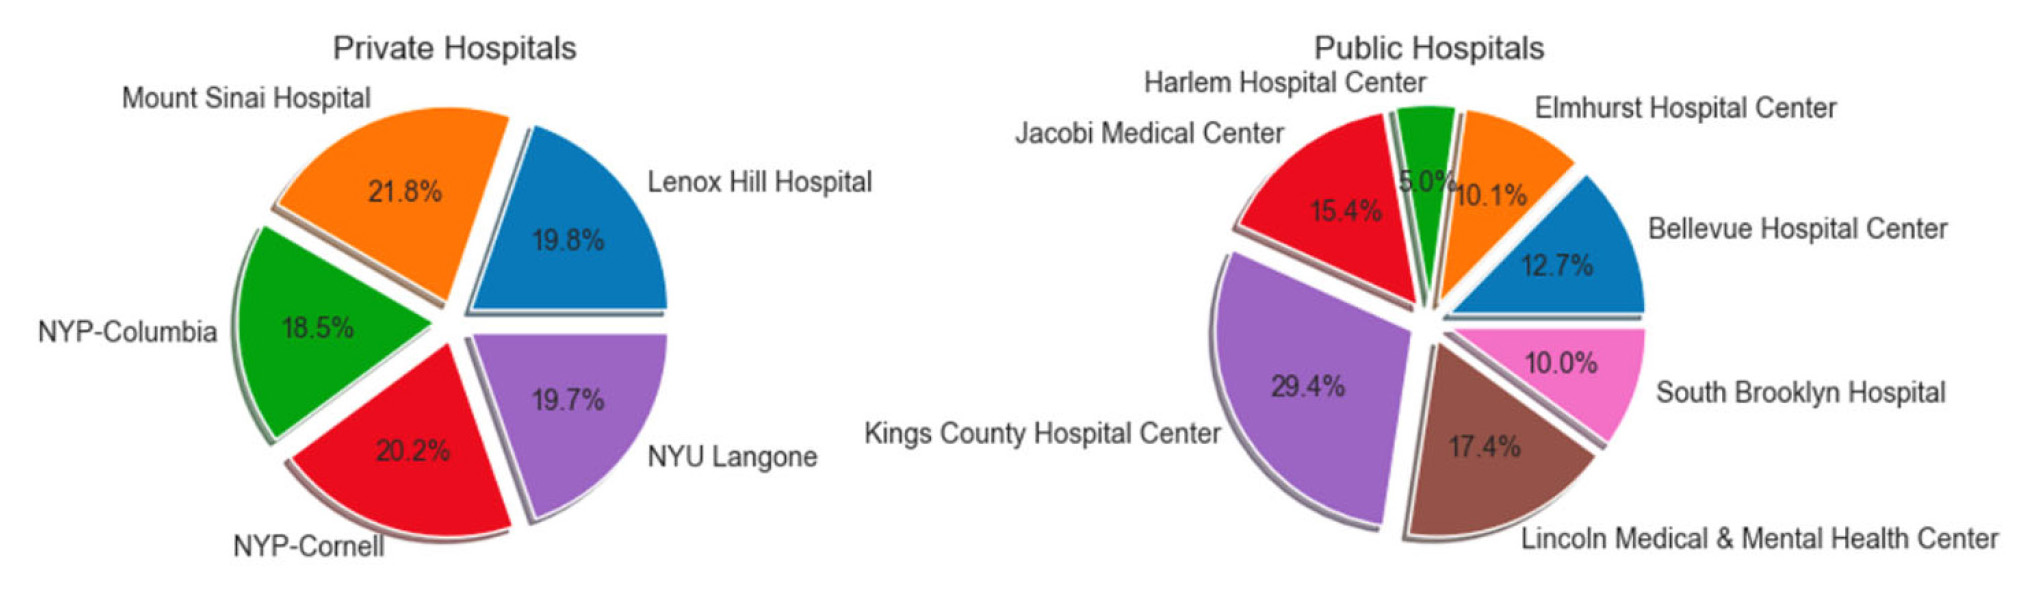
Figure 1.
This chart illustrates the distribution of included patients amongst public versus private hospitals
| (% Within Private) | (% Within Public) | |
| Female | 113,051 (50.6) | 46,224 (45.3) |
| Male | 110,304 (49.4) | 55,756 (54.7) |
| Black/African American | 25,956 (11.6) | 45,818 (44.9) |
| Multi-racial | 4,101 (1.8) | 299 (0.3) |
| Other Race | 78,331 (35.1) | 41,314 (40.5) |
| Unknown | 0 (0.0) | 53 (0.1) |
| White | 114,973 (51.5) | 14,506 (14.2) |
| 0 to 17 | 15,158 (6.8) | 3,781 (3.7) |
| 18 to 29 | 10,660 (4.8) | 6,359 (6.2) |
| 30 to 49 | 42,425 (19.0) | 19,179 (18.8) |
| 50 to 69 | 87,618 (39.2) | 41,543 (40.7) |
| 70 or Older | 67,500 (30.2) | 31,128 (30.5) |
| 223,361 | 101,990 |
| Hospital Types | Source of Payment |
(% within Private) | (% within Public) | |
| Private | Medicaid | 21,413 | 9,005 (8.6) | 12,408 (14.4) |
| Medicare | 67,048 | 30,797 (29.5) | 36,251 (42.0) | |
| Other | 7,058 | 5,691 (5.4) | 1,367 (1.6) | |
| Private | 72,067 | 46,201 (44.2) | 25,866 (30.0) | |
| Self-Pay | 2,151 | 797 (0.8) | 1,354 (1.6) | |
| Unknown | 21,018 | 11,962 (11.5) | 9,056 (10.5) | |
| Public | Medicaid | 15,211 | 1,543 (42.2) | 13,668 (28.2) |
| Medicare | 14,726 | 725 (19.8) | 14,001 (28.9) | |
| Other | 2,819 | 79 (2.2) | 2,740 (5.7) | |
| Private | 7,207 | 518 (14.2) | 6,689 (13.8) | |
| Self-Pay | 3,025 | 278 (7.6) | 2,747 (5.7) | |
| Unknown | 9,084 | 512 (14.0) | 8,572 (17.7) |
3.2Illness severity/Mortality risk scores
When comparing private and public hospitals, private hospitals were found to have significantly lower illness severity and mortality risk scores. In private hospitals, 29.3% of cases were categorized as high illness severity vs. 33.5% in public hospitals, leading to a high- to low-severity ratio of 0.415 in private hospitals vs. 0.503 in public hospitals (
3.3Admission type
Private hospitals were also found to have a markedly higher percentage of elective admissions compared to public hospitals. While 54.8% of private hospital admissions were elective, this was the case for only 7.0% of public hospital admissions, with non-elective cases making up 93.0% of their cases. In this manner, the elective versus non-elective case ratio in private versus public hospitals was 1.210 vs. 0.075 (
3.4Insurance type
Private hospital patients significantly differed from public patients in insurance type held (see Figure 2). When comparing the two groups, private hospitals had a significantly higher proportion of privately to publicly insured patients compared to public hospitals (
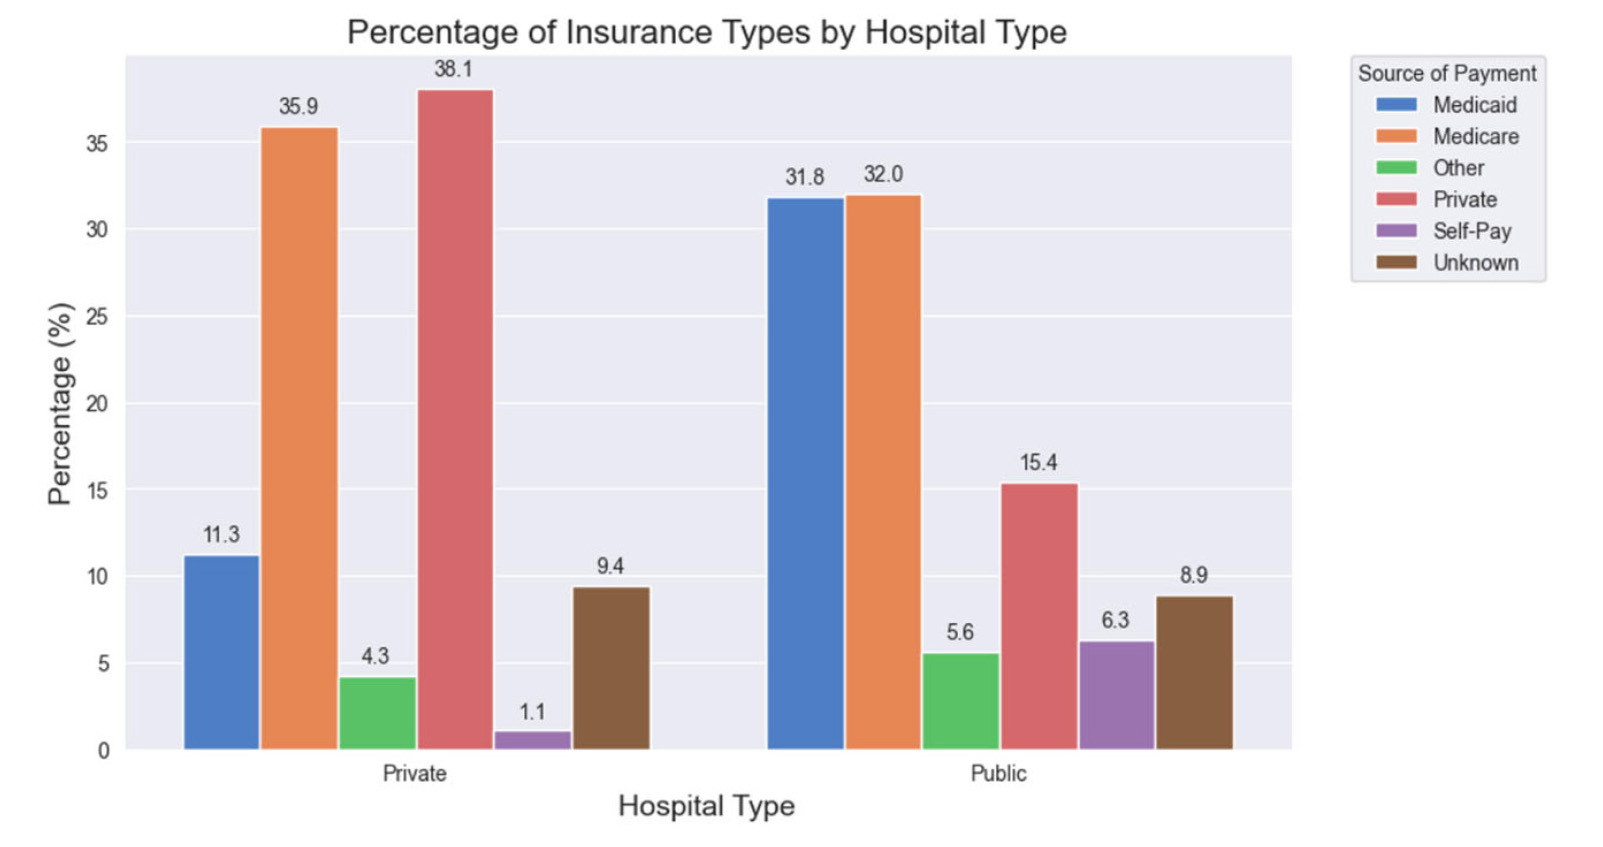
Figure 2.
This graph illustrates the distribution of insurance types by hospital type between public and private hospitals which was statistically significant in difference (
3.5Insurance stratified by admission type
Private and public hospitals varied when stratifying patients by insurance and elective versus non-elective admission status, as seen by Table 3. For both elective and non-elective admissions, there was a significant association between hospital type and payment source (
| Average Overall | 5.31 ± 0.01 days (95% CI: 5.28-5.34) |
7.09 ± 0.03 days (95% CI: 7.04-7.15) |
< .001 |
| High Illness Severity | 10.24 ± 0.04 days (95% CI: 10.15-10.33) |
12.66 ± 0.10 days (95% CI: 12.47-12.85) |
< .001 |
| Low Illness Severity | 3.39 ± 0.01 days (95% CI: 3.37-3.41) |
4.89 ± 0.03 days (95% CI: 4.83-4.95) |
< .001 |
| Elective | 3.66 ± 0.01 days (95% CI: 3.64-3.69) |
5.45 ± 0.12 days (95% CI: 5.23-5.68) |
< .001 |
| Non-Elective | 7.50 ± 0.03 days (95% CI: 7.44-7.56) |
7.65 ± 0.04 days (95% CI: 7.56-7.73) |
< .001 |
| Cranial Except Trauma | 7.11 ± 0.04 days (95% CI: 7.03-7.19) |
12.57 ± 0.14 days (95% CI: 12.30-12.84) |
< .001 |
| Traumatic Cranial | 7.91 ± 0.20 days (95% CI: 7.52-8.30) |
5.69 ± 0.08 days (95% CI: 5.53-5.85) |
< .001 |
| Shunt | 5.50 ± 0.10 days (95% CI: 5.30-5.70) |
9.13 ± 0.41 days (95% CI: 8.33-9.93) |
< .001 |
| Spinal Except Trauma | 4.44 ± 0.02 days (95% CI: 4.40-4.48) |
9.69 ± 0.11 days (95% CI: 9.47-9.91) |
< .001 |
| Spinal Trauma | 4.63 ± 0.04 days (95% CI: 4.55-4.71) |
5.33 ± 0.05 days (95% CI: 5.23-5.43) |
< .001 |
| Stroke | 5.22 ± 0.03 days (95% CI: 5.16-5.28) |
7.45 ± 0.04 days (95% CI: 7.37-7.53) |
< .001 |
3.6Etiologies
Case type distribution differed significantly between the private and public hospitals (
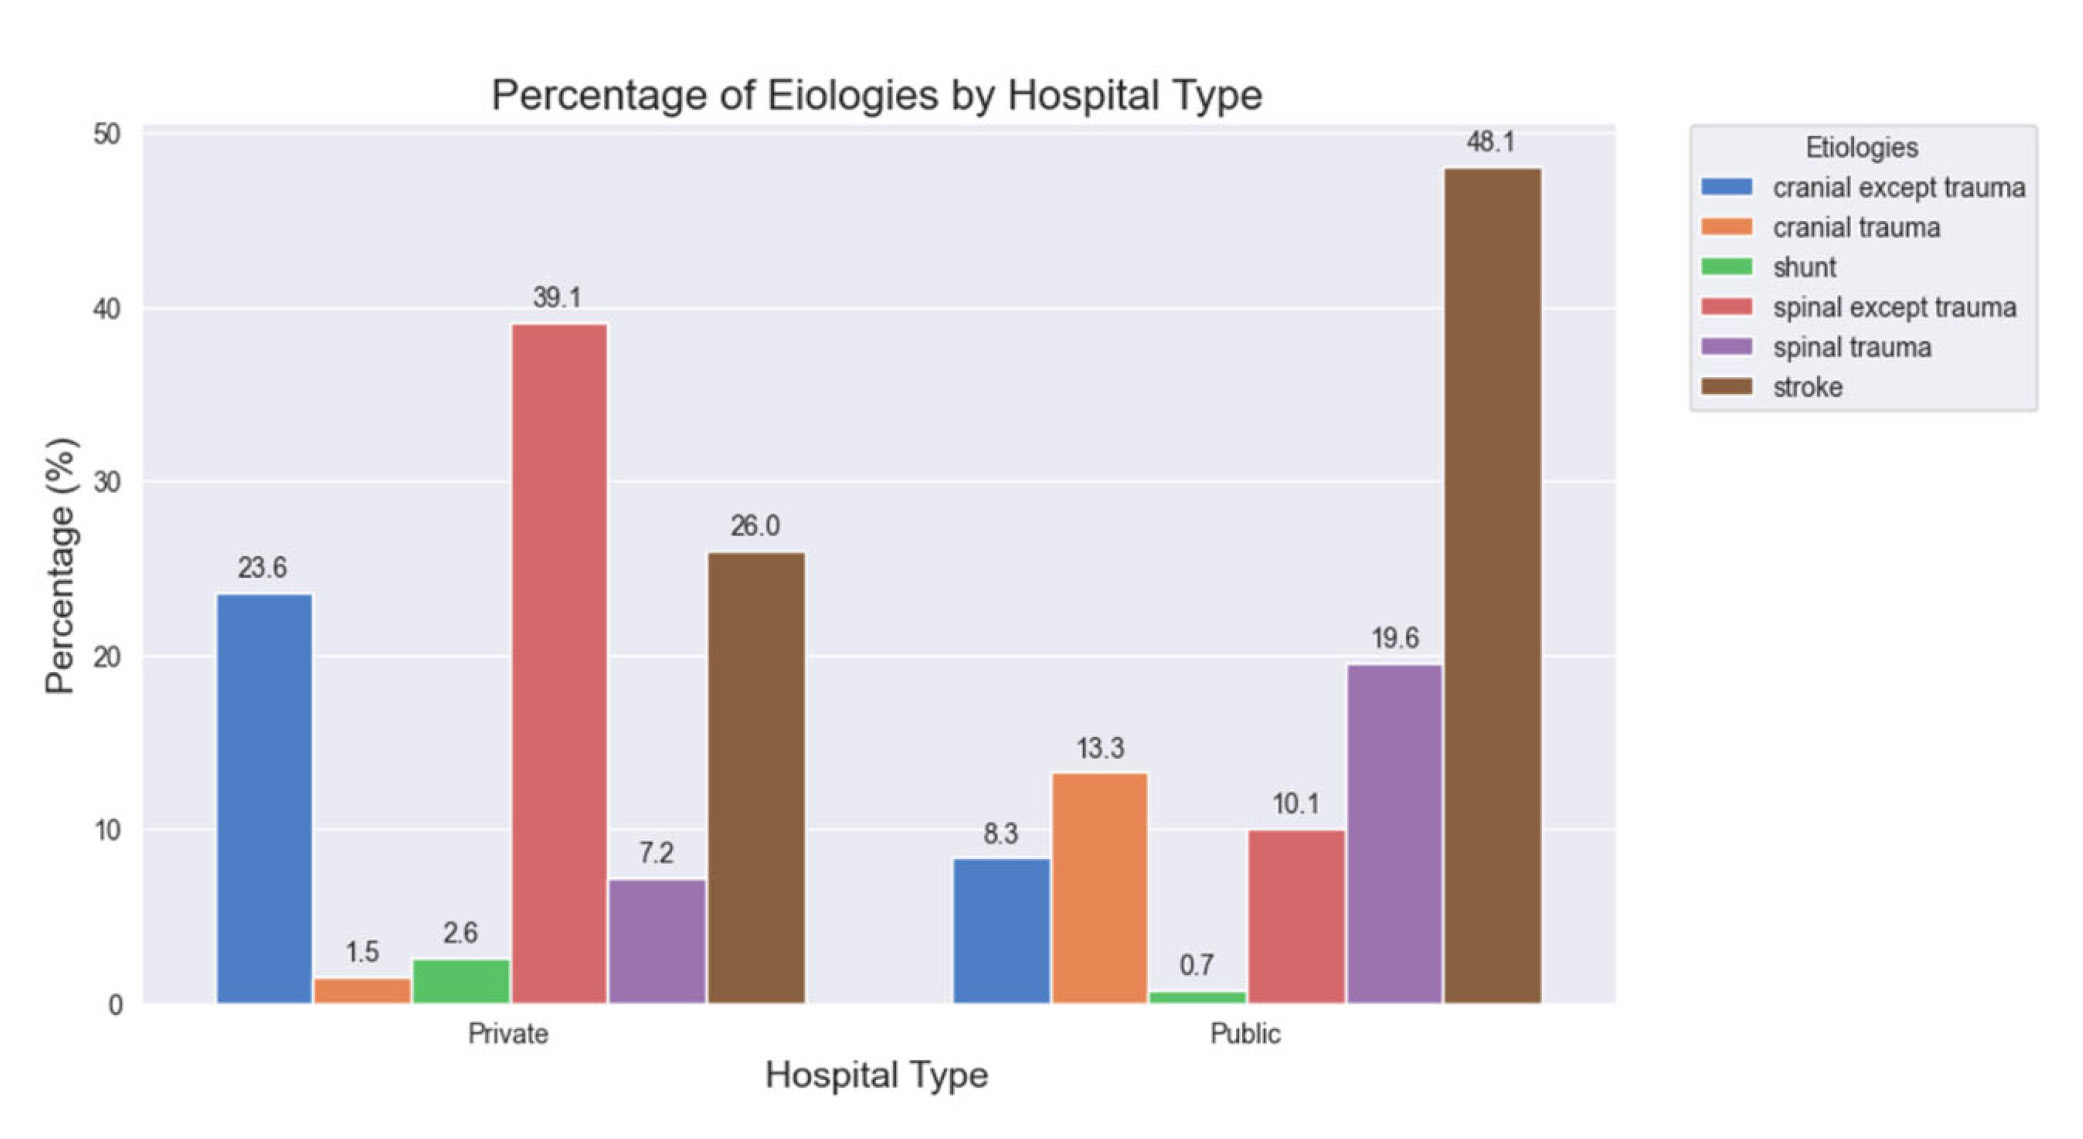
Figure 3.
This graph illustrates the distribution of etiologies by hospital type between public and private hospitals which was statisically signficiant in difference (
3.7Length of stay (Private vs. public and severity low vs. high)
When comparing hospital types, private hospitals had an average LOS of 5.34 days (95% CI: 5.28-5.34) compared to 7.10 days (95% CI: 7.04-7.15) for public hospitals (
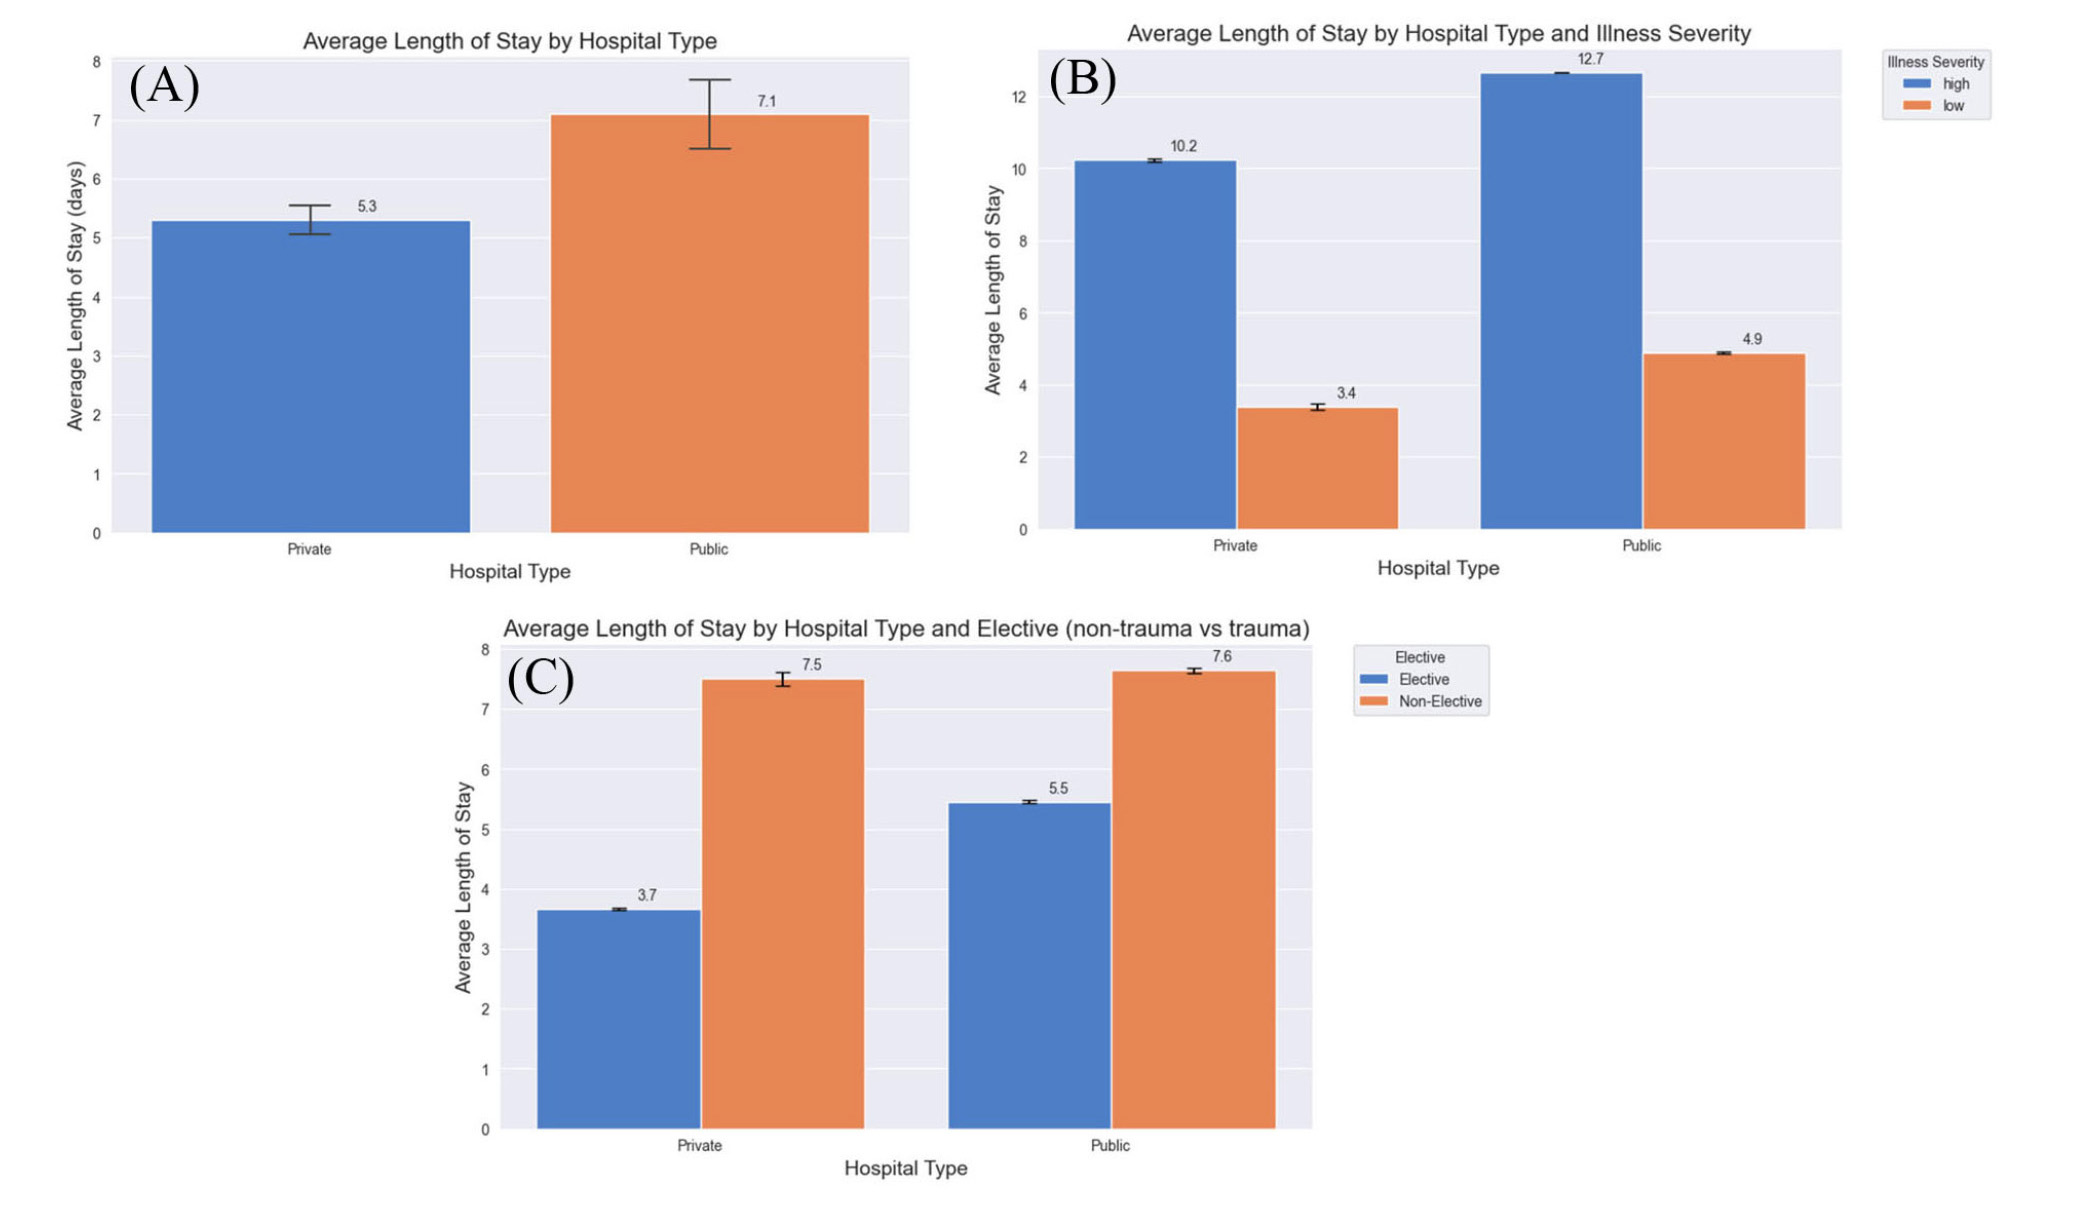
Figure 4.
This graph illustrates the LOS between public and private hospitals which was statisically signficiant in difference (
When stratifying specifically by case etiology, we observed further variation (see Figure 5). For non-traumatic cranial, non-traumatic spine, shunt, and stroke, the average LOS was longer in the public hospitals (
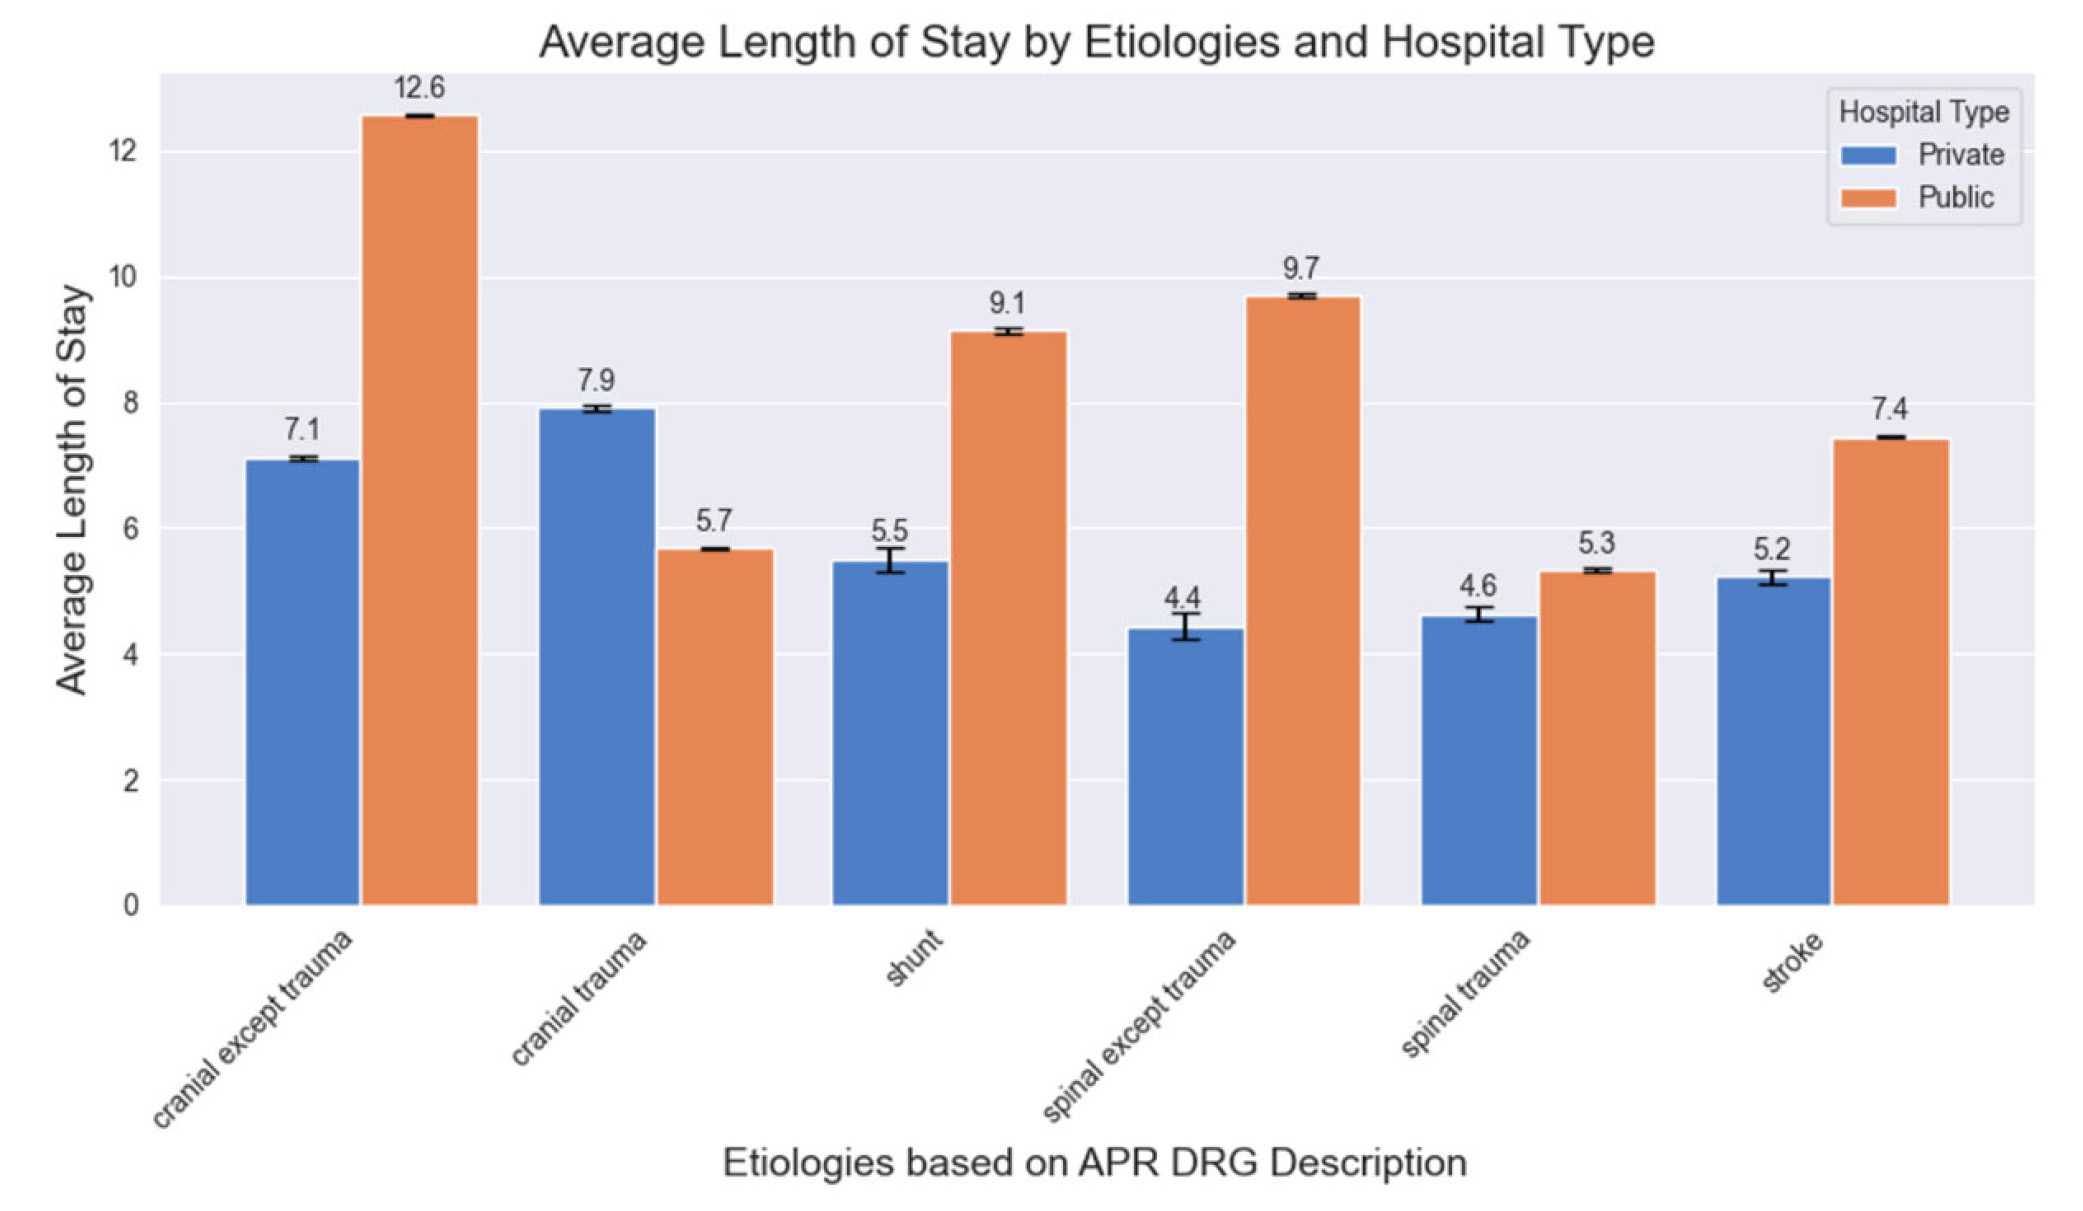
Figure 5.
This graph illustrates the LOS stratified by both hospital type and by etiology of patients. All etiologies divided by public vs. private hospital showed statisically different LOS (
3.8Discharge disposition
Private hospital patients significantly differed from public patients in discharge disposition (see Figure 6) (
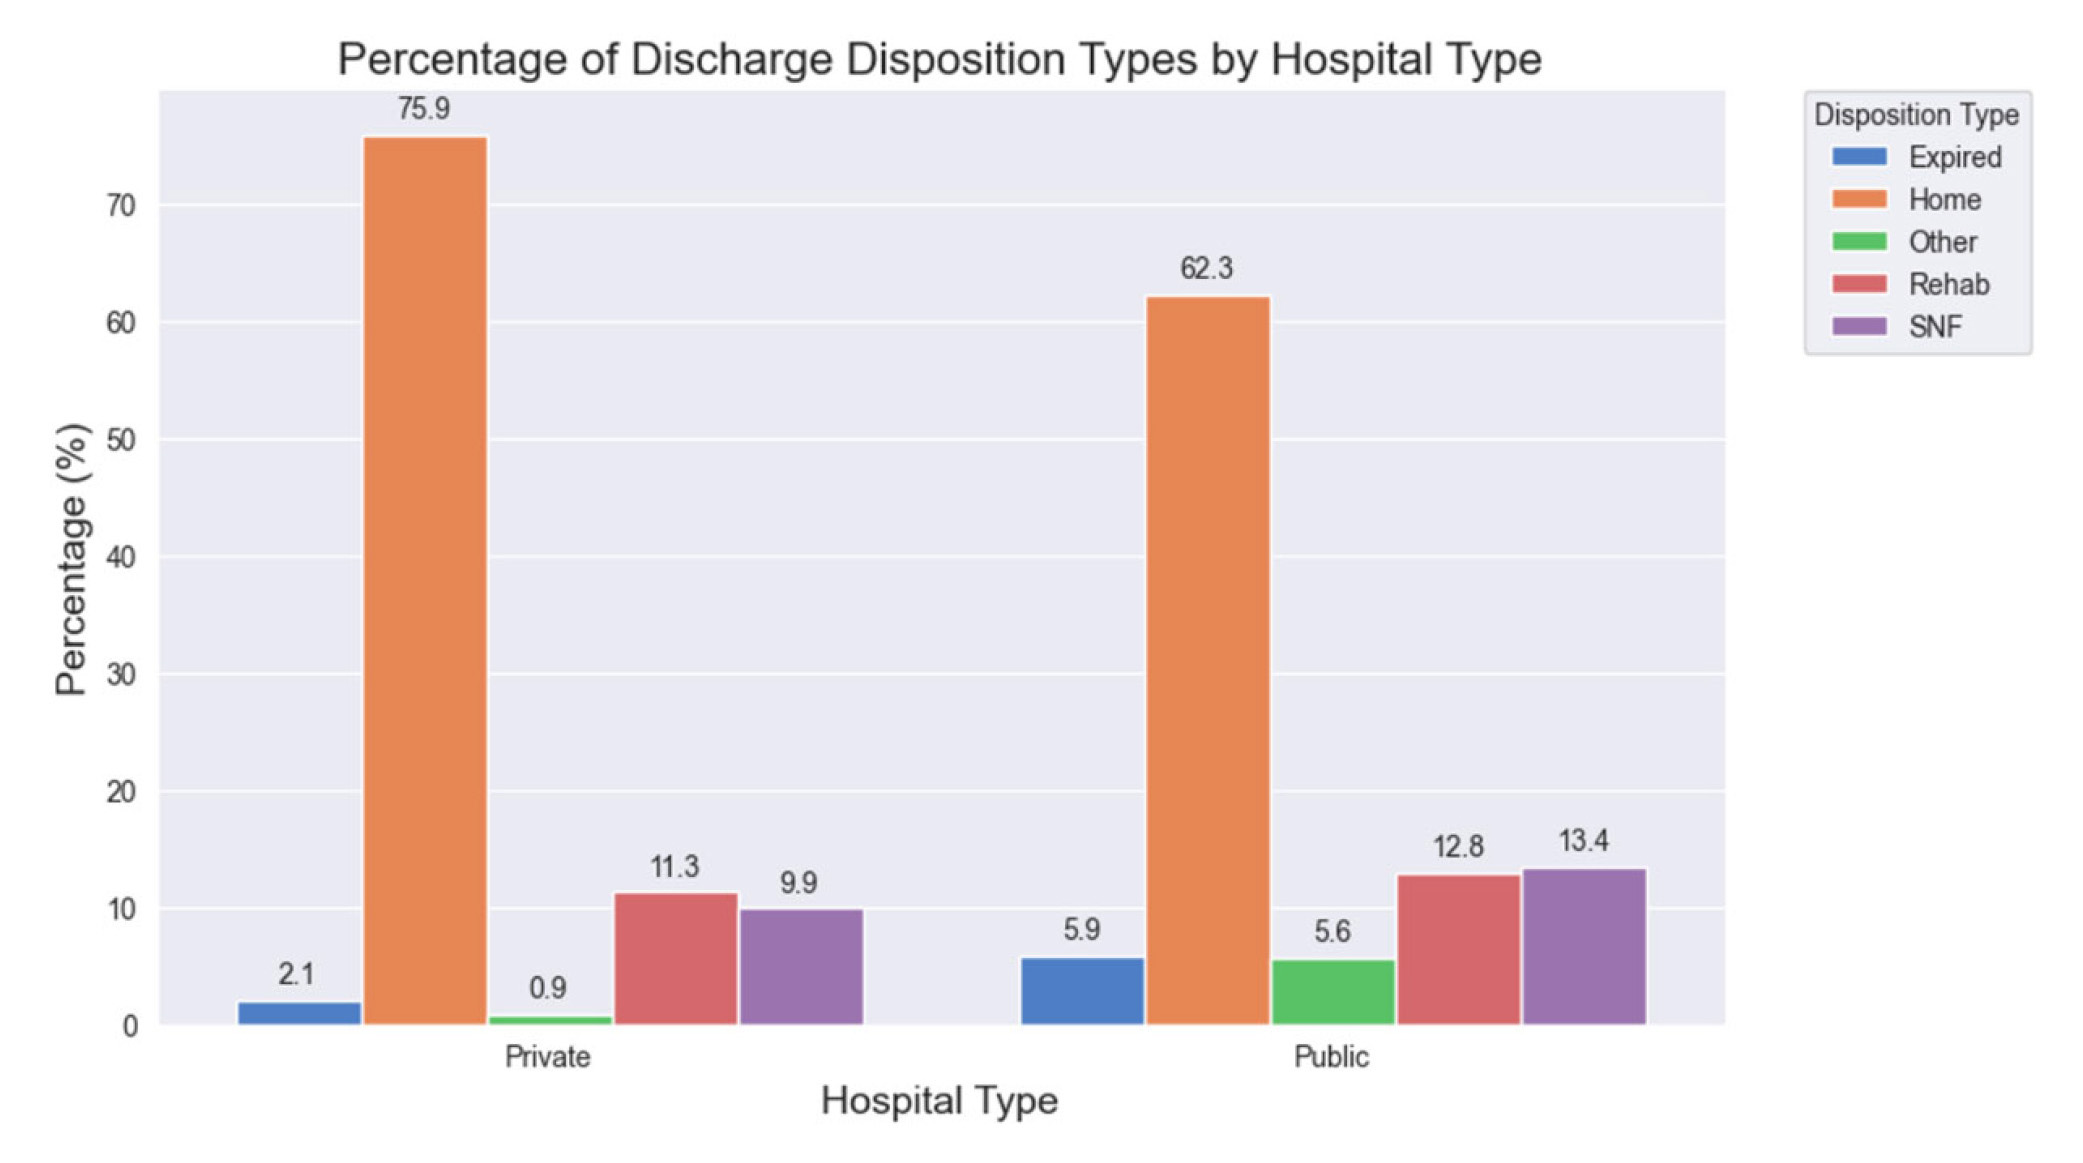
Figure 6.
This graph illustrates the discharge disposition stratified by hospital type. Private vs public hospitals showed a statisically signficiant difference in disposition (
3.9Level 1 trauma center comparison
Overall, the public hospital had a lower LOS at 5.4 days (95% CI: 5.28-5.54) vs. 7.6 days (95% CI: 7.19-8.03) at the private hospital (
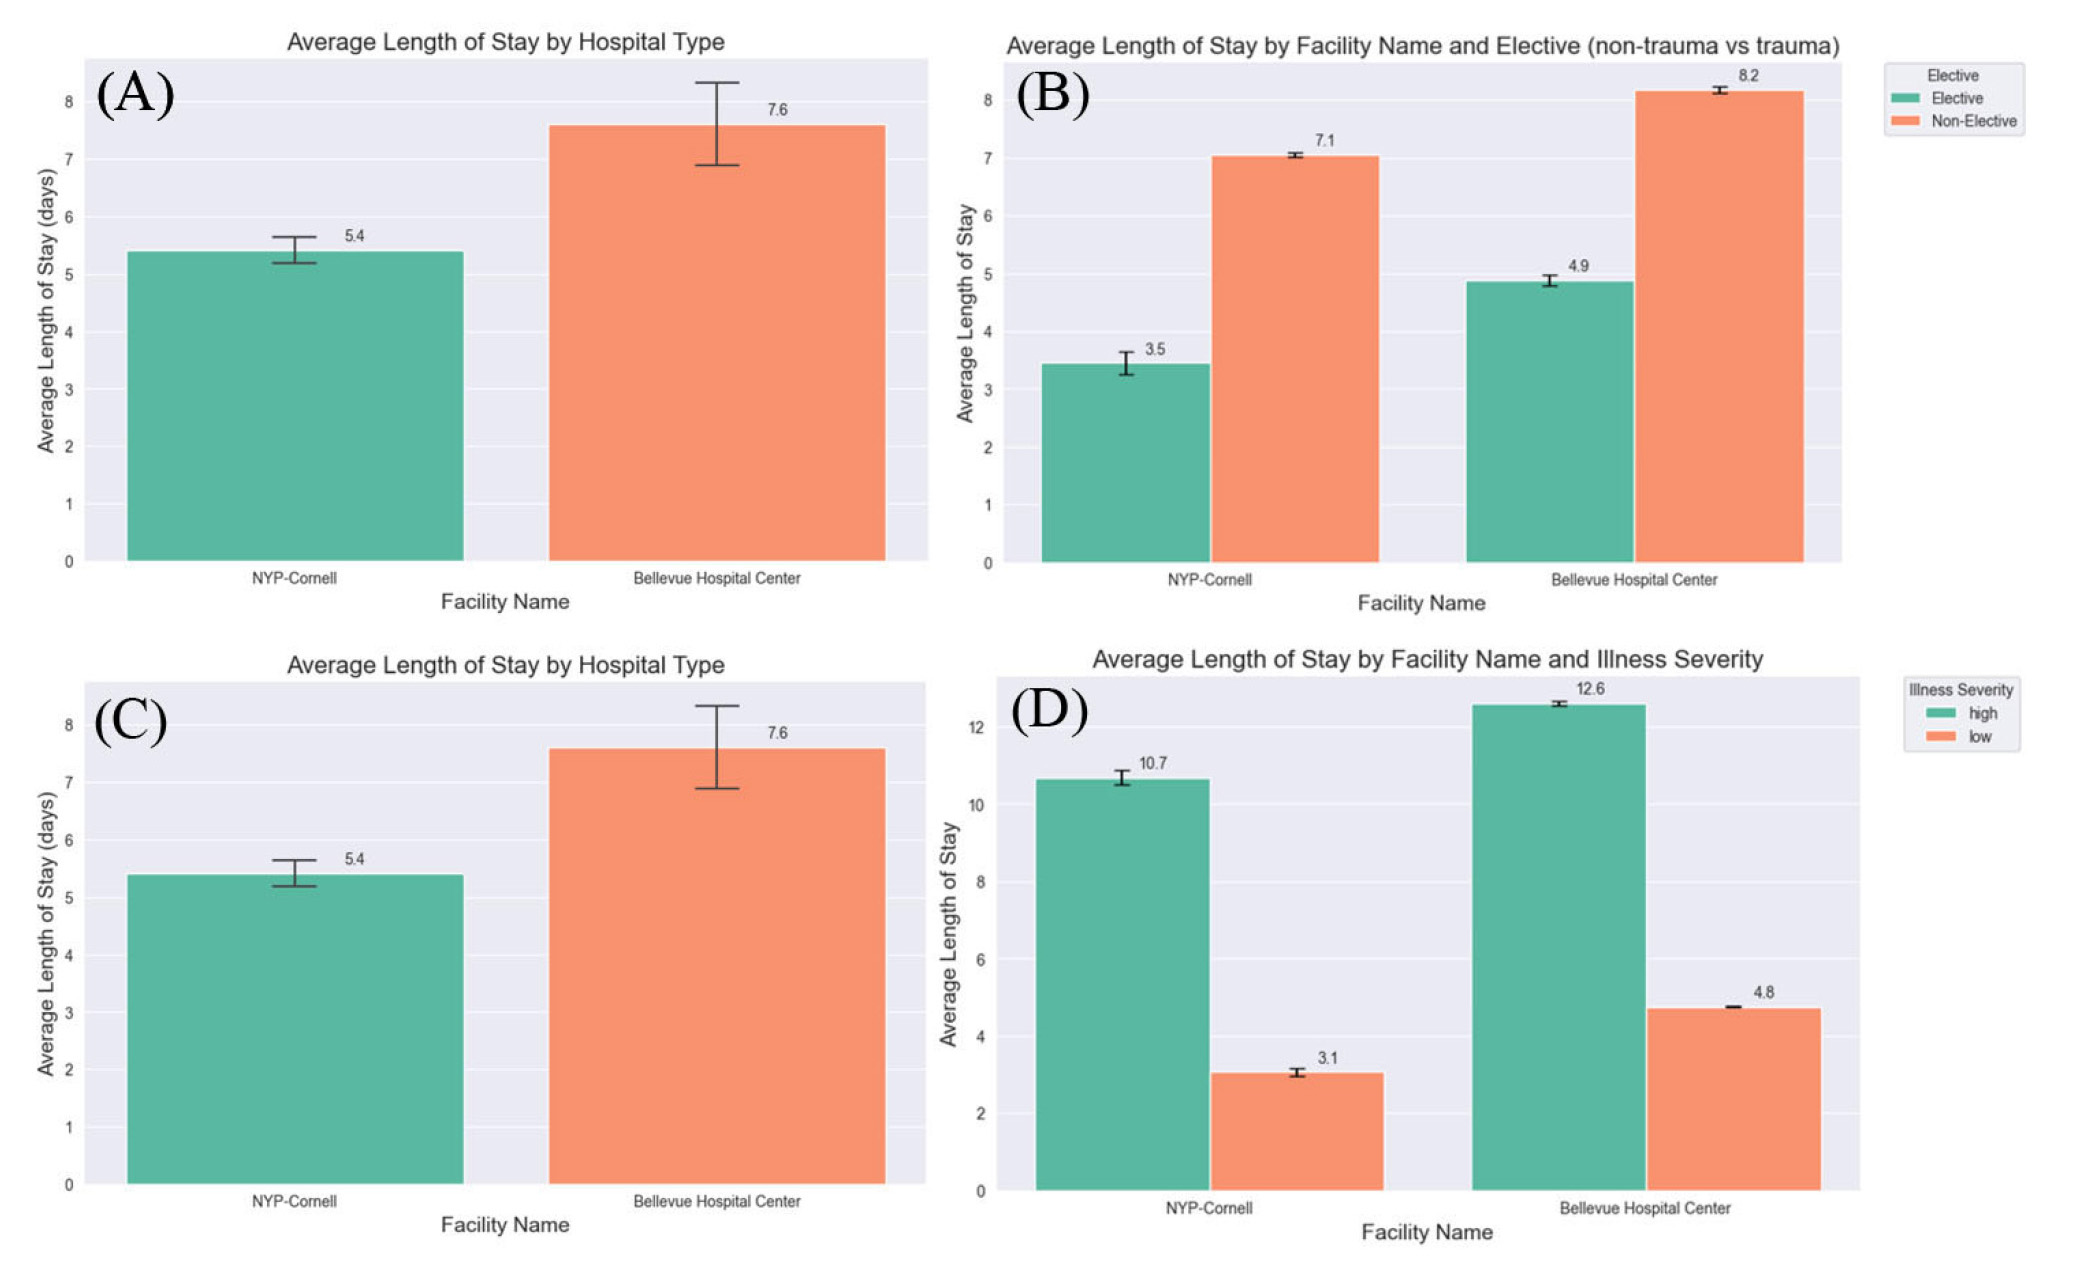
Figure 7.
These graphs highlight the comparison between a Level 1 public and private hospital
3.10Multivariate regression analysis
Our multivariate model explained 31.2% of the variance in LOS (
4.Discussion
After evaluating the data of 325,351 patients over 11 years, we calculated the unsurprising result that LOS at private hospitals was significantly shorter than at public hospitals, regardless of patient illness severity. Interestingly, there was no statistically significant difference in illness severity between hospital systems.
The NYC population identifies as 31.9% White, 21.1% Black, and 7.83% Hispanic.[13] Notably, public hospitals were also found to serve nearly four times the percentage of Black patients (63.8%). Current literature has characterized a wide range of health disparities that disproportionately impact minorities, with studies showing that Black patients are less likely to be privately insured and more likely to be uninsured relative to White patients.[14] In NYC, White households have a median net worth of $102,960 compared with $53,075 for Black households and $49,275 for Hispanic households.[15] 16.6% of Black households and 19.9% of Hispanic households fall below the poverty line compared to 6.8% of White households.[15] When looking at health outcomes, the total mortality per 100,000 is 575.3 for White, 796.3 for Black, and 624.5 for Hispanic individuals.[15] These disparities can be especially pronounced in densely populated urban centers like NYC. Therefore, this study finding statistically significant differences in patient race and insurance status between private and public hospitals supports the notion that public hospitals care for a greater proportion of the medically underserved population.
The assessment of patient insurance status provides an understanding of how the public and private hospital patient populations differ. Only 15.4% of public hospital patients were privately insured compared to 38.1% of private hospital patients, and the percentage of uninsured patients (insurance status was categorized as “self-pay”) was more than five times higher for public hospitals compared to private hospitals. Especially for elective procedures, care at private institutions may be widely inaccessible for those without insurance.
Public and private hospitals also differed markedly with respect to their percentage of elective versus non-elective admissions, with 93% of public hospital admissions being non-elective versus only 45.2% of private hospital admissions. All the public hospitals with neurosurgical services available, and therefore included in this study, are Level 1 trauma centers. Only one private institution in Manhattan is a Level 1 trauma center. This may explain why the public hospitals as a whole see a far greater proportion of trauma: public hospitals saw more than two times the percentage of spine trauma and more than seven times the percentage of cranial trauma. Several other factors may explain this difference. Prior research has demonstrated that non-white patients are more likely to suffer traumatic injury than their White counterparts,[16] which may also explain why public hospital patients comprise a more diverse demographic makeup. This, in conjunction with Level I Trauma Center status, may also help explain the greater proportion of high-mortality-risk patients treated at public hospitals. This trend also elucidates a key financial burden on public hospitals. Chavez et al. established that level 1 trauma centers primarily treat publicly insured patients, with a negative average contribution margin fo Medicaid (-$8,979) and Medicare (-$2,145) patients compared with privately insured patients (+$16,913) when expected LOS was exceeded.[17] This is worsened by the fact that LOS in trauma and emergency surgical settings is often unpredictable, which could increase costs for public trauma hospitals.[18]
Another major finding of this study was the significant difference in LOS between hospital systems. Inter-hospital differences in LOS can carry significant ramifications for hospital resources and funding; studies have shown that LOS can statistically explain over 80% of the interpatient variation in hospital costs.[19] The association of cost burden with increased of LOS was particularly exemplified by the COVID-19 pandemic, in which patients admitted to the ICU, requiring a mean LOS of 15 days, resulted in an average charge of $198,394 and hospital cost of $54,402 compared with the median charge of $43,986 and cost of $12,046 for a median LOS of 5 days.[20] In our study, private hospitals had a significantly lower LOS than public hospitals, a result that stayed true regardless of high- or low-severity patient status. A patient’s time spent in the hospital may feasibly be impacted by many factors, both clinical and nonclinical. For example, while illness severity and clinical characteristics play a major role in determining LOS variability, significant associations have been found between LOS and patient age, race, sex, insurance status, discharge destination, and Revised Trauma Score.[21—24] The significant differences between private and public hospital patient populations elucidated in our study, as well as the higher rate of non-elective or traumatic cases in public hospitals, likely play a role in explaining the public hospitals’ longer average LOS. Additionally, similar trends have been previously established showing that private spine neurosurgical centers treat a higher proportion of younger and healthier patients, with a two-day shorter average LOS.[25] Similar trends have also been seen with reduced LOS in private hospitals compared with public hopsitals in other specialties such as obstetrics/gynecology and cardiology.[26,27]
Our multivariate analysis further elucidates the complex interplay of factors influencing LOS. Our model, which accounted for 31.2% of the variance in LOS, revealed that discharge disposition to SNF or rehabilitation facilities, non-elective admission type, and public hospital type were the strongest predictors of increased LOS. Disposition planning in neurosurgery can be a critical factor delaying discharge, as communication between insurance, the medical team, family members, and rehabilitation facilities often results in a patient’s LOS extending beyond the date they are medically ready for discharge.[28,29] Furthermore, we observed significant interactions between key variables like age and illness severity, admission type and illness severity, etiology and hospital type, and illness severity and hospital type. These interactions suggest that the effects of patient characteristics and hospital factors on LOS are not uniform but vary depending on other conditions. In particular, we found that the effect of illness severity on LOS is moderated by several factors. For instance, the interaction between age and illness severity (
Interestingly, the effect of illness severity on LOS also differed between public and private hospitals (
Prior studies have also suggested that LOS can serve as an effective proxy for hospital efficiency and availability of ancillary support services such as social work or more robust nursing care.[31—33] The disparities in LOS between private and public hospitals may be attributable to variables affecting efficiency of care including differences in funding, resource availability, and staffing. For example, private academic centers have higher accessibility to novel minimally invasive techniques such as laser interstitial therapy for epilepsy, resulting in a decreased LOS for privately insured patients.[34] Notably, public hospitals had a shorter LOS for traumatic cranial etiologies and a similar LOS to private hospitals for traumatic spinal etiologies. These differentiation points may suggest that these hospitals are specialized for different purposes. They are more adapted to the etiologies they more commonly see, resulting in distinct LOS trends. The observed shortened LOS for cranial trauma cases remained stable when comparing public and private Level I trauma centers. In this comparison, the decreased LOS for cranial trauma patients at the public trauma center cannot be attributable to the special processes put in place for Level I trauma certification. This may be due to the difference in focus between the institutions, since there may be much greater demand for resources for elective care and patients at the private institution.
Ultimately LOS can serve as a marker of efficiency of care. Efficiency of care is important for hospital reimbursement, which can further facilitate building and maintaining resources for patient care. With these disparities in LOS and current reimbursement models, this can continue to perpetuate disparities in resources and care moving forward. Current hospital reimbursement models operate on a volume-based payment system, though concern has been growing surrounding unsustainably rising healthcare costs that may not necessarily correlate with improved quality of care.[35] Episode-based bundled payments, which bundle payments to inpatient and outpatient providers and services, incentivize controlling costs and reducing readmission rates.[36] While this model has not yet been applied to cranial neurosurgical procedures, recent studies have investigated their potential to increase cost efficiency and coordination of neurosurgical care.[37] Additionally, enhanced recovery after surgery (ERAS) protocols offer a novel methodology to streamline workflows and promote hospital efficiency to reduce LOS. Such methods have been recently developed in academic neurosurgical settings with promising results.[38—40] However, while these ERAS protocols have improved LOS and outcomes on average, there are still clear disparities, as non-White patients within ERAS protocols still have higher average LOS compared to White counterparts.[41] Therefore these areas provide promising areas of continued research to alleviate some of the disparities affecting the current healthcare system.
Study limitations
Though APR-DRG terms were thoroughly assessed, and neurosurgical terms were reviewed and confirmed by a board-certified neurosurgeon, there is a possibility of unassessed cases due to overlap with other specialties. Certain terms had high potential of care with a non-neurosurgical primary physician. While they were excluded to focus this analysis on neurosurgery as directly as possible, they allow for potential sample size loss. There is also a risk of overlap between our included neurosurgical APR-DRG terms and other specialties due to the treatment of some etiologies such as spinal fusion by non-neurosurgical specialists. Additionally, patients in SPARCS are coded by diagnosis, not procedure, so this database could be inclusive of non-operative patients. Furthermore, the accuracy of the data in the SPARCS database could not be assessed by our methods.
Additionally, while trends were analyzed over the entire span of 2009 to 2021, COVID-19 likely impacted the cases shown in 2020 and 2021. We attempted to mitigate this by including more recent data from 2022.
5.Conclusions
Efficiency of care can be a marker of quality of care. In our study, we are able to compare hospitals in a small geographic region with many neurosurgical specialists and use LOS as a proxy for the efficiency of care at private and public hospitals. LOS was seen to be shorter at private hospitals in all instances except in traumatic cranial cases where the LOS is shorter at public hospitals. This may imply that a hospital’s clinical focus may translate into expanded resources for certain case types to improve the efficiency of care. These findings indicate the need to further analyze patient accessibility to neurosurgical care at private hospitals and the resources necessary to support neurosurgical practices within public hospitals.
Authors contributions
Alexander N. Eremiev: submission of final manuscript, manuscript writing, formulation of project; Cordelia Orillac, Camiren Carter, Eric Grin, Derek Huell, Sophie Yagoda: manuscript writing; Karl Sangwon: data analysis, figure production; David B. Kurland: manuscript writing, figure production; David H. Harter: supervision of project, review of manuscript.
Funding
NA.
Conflicts of Interest Disclosure
The authors declare they have no conflicts of interest.
Informed consent
Obtained.
Ethics approval
The Publication Ethics Committee of the Sciedu Press. The journal’s policies adhere to the Core Practices established by the Committee on Publication Ethics (COPE).
Provenance and peer review
Not commissioned; externally double-blind peer reviewed.
Data availability statement
This publication was produced publicly available data reports from the New York Department of Health. Reports from 2009 to 2021 titled “Hospital Inpatient Discharges (SPARCS De-Identified): Year” were utilized. Data are publicly accessible at the following website: https://health.data.ny.gov/browse. The New York State Department of Health makes no representation, warranty or guarantee relating to the data or analyses derived from these data.[42—55]
Data sharing statement
No additional data are available.
Acknowledgements
All data were obtained from the Statewide Planning and Research Cooperative System (SPARCS) as collected by the New York State Department of Health.
References
- Owolo E, Seas A, Bishop B. Scoping review on the state of racial disparities literature in the treatment of neurosurgical disease: a call for action. 2023;55(5):E3. doi:10.3171/2023.8.FOCUS23466
- Pugazenthi S, Barpujari A, Patel S. A Systematic Review of the State of Neurosurgical Disparities Research: Past, Present, and Future. World Neurosurg. 2024;182:193-199.e4. doi:10.1016/j.wneu.2023.11.127
- Rana R, Alam K, Gow J. Selection of private or public hospital care: examining the care-seeking behaviour of patients with private health insurance. BMC Health Serv. Res. 2020;20:380. doi:10.1186/s12913-020-05253-y
- Lucifora C. Management practices in hospitals: A public-private comparison. PLoS One. 2023;18:e0282313. doi:10.1371/journal.pone.0282313
- Anesi G, Kerlin M. The impact of resource limitations on care delivery and outcomes: routine variation, the coronavirus disease 2019 pandemic, and persistent shortage. Curr. Opin. Crit. Care. 2021;27:513-519. doi:10.1097/MCC.0000000000000859
- Mbau R, Musiega A, Nyawira L. Analysing the Efficiency of Health Systems: A Systematic Review of the Literature. Appl. Health Econ. Health Policy. 2023;21:205-224. doi:10.1007/s40258-022-00785-2
- Asbu E, Masri M, Al Naboulsi M. Determinants of hospital efficiency: A literature review. Int. J. Healthc. Inf. Syst. Inform. 2020;6:44. doi:10.5430/ijh.v6n2p44
- Dehouche N, Viravan S, Santawat U. Hospital length of stay: A cross-specialty analysis and Beta-geometric model. PLoS One. 2023;18:e0288239. doi:10.1371/journal.pone.0288239
- Buttigieg S, Abela L, Pace A. Variables affecting hospital length of stay: a scoping review. J. Health Organ. Manag. 2018;32:463-493. doi:10.1108/JHOM-10-2017-0275
- PLOS ONE Staff. Correction: Risk factors associated with prolonged hospital length-of-stay: 18-year retrospective study of hospitalizations in a tertiary healthcare center in Mexico. PLoS One. 2018;13:e0209944. doi:10.1371/journal.pone.0209944
- Besa J, Masamayor E, Tamondong-Lachica D. Prevalence and predictors of prolonged length of stay among patients admitted under general internal medicine in a tertiary government hospital in Manila, Philippines: a retrospective cross-sectional study. BMC Health Serv. Res. 2023;23:50. doi:10.1186/s12913-022-08885-4
- Garba D, Fadalla T, Sarpong K. Access to training in neurosurgery (Part 2): The costs of pursuing neurosurgical training. Brain Spine. 2022;2:100927. doi:10.1016/j.bas.2022.100927
- New York, NY. https://datausa.io/profile/geo/new-york-ny
- Yancy C. COVID-19 and African Americans. JAMA. 2020;323:1891-1892. doi:10.1001/jama.2020.6548
- New York city health indicators by race/ethnicity, 2018-2020. https://www.health.ny.gov/statistics/community/minority/county/newyorkcity.htm
- Haider A, Weygandt P, Bentley J. Disparities in trauma care and outcomes in the United States: a systematic review and meta-analysis. J. Trauma Acute Care Surg. 2013;74(5):1195-205. doi:10.1097/01586154-201305000-00002
- Chavez M, Bogert J, Soe-Lin H. Length of stay and trauma center finances: A disparity of payer source at a Level I trauma center. J. Trauma Acute Care Surg. 2022;92(4):683-690. doi:10.1097/TA.0000000000003529
- Stocker B, Weiss H, Weingarten N. Predicting length of stay for trauma and emergency general surgery patients. Am. J. Surg. 2020;220(3):757-764. doi:10.1016/j.amjsurg.2020.01.055
- Rapoport J, Teres D, Zhao Y. Length of stay data as a guide to hospital economic performance for ICU patients. Med. Care. 2003;41:386-397. doi:10.1097/01.MLR.0000053021.93198.96
- Di Fusco M, Shea K, Lin J. Health outcomes and economic burden of hospitalized COVID-19 patients in the United States. J. Med. Econ. 2021;24(1):308-317. doi:10.1080/13696998.2021.1886109
- Brasel K, Lim H, Nirula R. Length of stay: an appropriate quality measure? Arch. Surg. 2007;142:461-5. discussion 465-6 doi:10.1001/archsurg.142.5.461
- Rapoport J, Teres D, Lemeshow S. Explaining variability of cost using a severity-of-illness measure for ICU patients. Med. Care. 1990;28:338-348. doi:10.1097/00005650-199004000-00005
- Oye R, Bellamy P. Patterns of resource consumption in medical intensive care. Chest. 1991;99:685-689. doi:10.1378/chest.99.3.685
- Detsky A, Stricker S, Mulley A. Prognosis, survival, and the expenditure of hospital resources for patients in an intensive-care unit. N. Engl. J. Med. 1981;305:667-672. doi:10.1056/NEJM198109173051204
- Danielsen E, Mjåset C, Ingebrigtsen T. A nationwide study of patients operated for cervical degenerative disorders in public and private hospitals. Sci. Rep. 2022;12:1-8. doi:10.1038/s41598-022-17194-z
- Zheng J, Tisdale R, Heidenreich P. Disparities in Hospital Length of Stay Across Race and Ethnicity Among Patients With Heart Failure. Circ. Heart Fail. 2022;15. doi:10.1161/CIRCHEARTFAILURE.121.009362
- Parra R, Feitosa M, Valerio F. Laparoscopic bowel resection of deep infiltrating endometriosis. Comparative outcomes of a public teaching hospital and a referral private hospital. Acta Cir. Bras. 2020;35. doi:10.1590/s0102-865020200090000008
- Linzey J, Foshee R, Moriguchi F. Length of Stay Beyond Medical Readiness in a Neurosurgical Patient Population and Associated Healthcare Costs. Neurosurgery. 2021;88(3):E259-E264. doi:10.1093/neuros/nyaa535
- Lubelski D, Ehresman J, Feghali J. Prediction calculator for nonroutine discharge and length of stay after spine surgery. Spine J. 2020;20(7):1154-1158. doi:10.1016/j.spinee.2020.02.022
- Akbari S, Rizvi A, CreveCoeur T. Socioeconomic and demographic factors in the diagnosis and treatment of Chiari malformation type I and syringomyelia. J. Neurosurg. Pediatr. 2021;29(3):288-297.
- Krell R, Girotti M, Dimick J. Extended length of stay after surgery: complications, inefficient practice, or sick patients. JAMA Surg. 2014;149:815-820. doi:10.1001/jamasurg.2014.629
- Murphy M, Noetscher C. Reducing hospital inpatient lengths of stay. J. Nurs. Care Qual. 1999;14(1):40-54. doi:10.1097/00001786-199911000-00006
- Han T, Murray P, Robin J. Evaluation of the association of length of stay in hospital and outcomes. Int. J. Qual. Health Care. 2022;34(2):mzab160. doi:10.1093/intqhc/mzab160
- Singh R, Zamanian C, Bcharah G. High-Value Epilepsy Care in the United States: Predictors of Increased Costs and Complications from the National Inpatient Sample Database 2016-2019. World Neurosurg. 2024;185:e1230-e1243. doi:10.1016/j.wneu.2024.03.061
- Hines K, Mouchtouris N, Getz C. Bundled Payment Models in Spine Surgery. Global Spine J. 2021;11:7S-13S. doi:10.1177/2192568220974977
- Joynt Maddox K, Orav E, Zheng J. Evaluation of Medicare’s Bundled Payments Initiative for Medical Conditions. N. Engl. J. Med. 2018;379:260-269. doi:10.1056/NEJMsa1801569
- Medress Z, Ugiliweneza B, Parker J. Simulating Episode-Based Bundled Payments for Cranial Neurosurgical Procedures. Neurosurgery. 2020;87:86-95. doi:10.1093/neuros/nyz353
- Khan H, Hill T, Suryadevara C. Development and implementation of an Enhanced Recovery After Cranial Surgery pathway following supratentorial tumor resection at a tertiary care center. Neurosurg. Focus. 2023;55(6):E4. doi:10.3171/2023.9.FOCUS23552
- Debono B, Wainwright T, Wang M. Consensus statement for perioperative care in lumbar spinal fusion: Enhanced Recovery After Surgery (ERAS®) Society recommendations. Spine J. 2021;21(5):729-752. doi:10.1016/j.spinee.2021.01.001
- Dietz N, Sharma M, Adams S. Enhanced Recovery After Surgery (ERAS) for Spine Surgery: A Systematic Review. World Neurosurg. 2019;130:415-426. doi:10.1016/j.wneu.2019.06.181
- Howard S, Aysola J, Montgomery C. Post-operative neurosurgery outcomes by race/ethnicity among enhanced recovery after surgery (ERAS) participants. Clin. Neurol. Neurosurg. 2023;24:107561. doi:10.1016/j.clineuro.2022.107561
- New York State Department of Health. Hospital inpatient discharges (SPARCS DE-identified): 2019. 2022.
- New York State Department of Health. Hospital inpatient discharges (SPARCS DE-identified): 2009. 2013.
- New York State Department of Health. Hospital inpatient discharges (SPARCS DE-identified): 2010. 2013.
- New York State Department of Health. Hospital inpatient discharges (SPARCS DE-identified): 2011. 2013.
- New York State Department of Health. Hospital inpatient discharges (SPARCS DE-Identified): 2012. 2013.
- New York State Department of Health. Hospital inpatient discharges (SPARCS DE-identified): 2013. 2014.
- New York State Department of Health. Hospital inpatient discharges (SPARCS DE-identified): 2014. 2016.
- New York State Department of Health. Hospital inpatient discharges (SPARCS DE-identified): 2015. 2017.
- New York State Department of Health. Hospital inpatient discharges (SPARCS DE-identified): 2016. 2018.
- New York State Department of Health. Hospital inpatient discharges (SPARCS DE-identified): 2017. 2019.
- New York State Department of Health. Hospital inpatient discharges (SPARCS DE-identified): 2018. 2022.
- New York State Department of Health. Hospital inpatient discharges (SPARCS DE-identified): 2021. 2022.
- New York State Department of Health. Hospital inpatient discharges (SPARCS DE-identified): 2020. 2022.
- New York State Department of Health. Hospital inpatient discharges (SPARCS DE-identified): 2022. 2024.
 This work is licensed under a