1.introduction
In the United States (U.S.), pancreatic cancer (PC) ranks as the 12th most common cause of cancer, but it is the 4th most common cause of cancer-related deaths.[1] This makes it the most challenging type of cancer because of its poor prognosis and high case fatality. Current estimates anticipate about 66,440 new cases and 51,750 deaths by 2024. With an aging population and changing demographics, the incidence of PC is expected to increase. While five-year survival rates have improved in the last 20 years, PC continues to be a deadly solid organ malignancy.[2] The poor prognosis stems from several factors, which include late-stage presentation, aggressive tumor biology, and limited therapeutic responsiveness, which, combined, lead to increased hospitalizations, surgical interventions, and complication management.[3] As one of the fastest-growing and aging states in the (U.S.), Florida exemplifies the national burden as it ranks the 2nd in PC deaths.[4] This is also amplified when taking into account the multifaceted disparities due to social determinants of health disparities factors.[5] Prior studies have indicated that various sociodemographic factors contribute to disparities in PC care and outcomes. A recent study found that patients with lower socioeconomic status often face delays in treatment, which can exacerbate health outcomes.[6] A recent 2025 study found that Black/African American individuals face substantially elevated mortality risks, with adjusted odds ratios of 1.339 compared to White individuals.[7] It is important to note that these disparities extend beyond mortality but also to care access and quality of care, such as length of stay (LOS).[4]
In PC care, hospital characteristics have been shown to influence patient outcomes (in-hospital mortality and LOS). Factors such as teaching status, hospital size measured by the number of staffed beds, and nursing ratios are associated with patient outcomes, suggesting the need to understand these factors and optimize them.[8,9,10,11] However, current gaps exist in the literature, and prior studies have inadequately examined relationships between patient demographics, hospital characteristics, and county-level social determinants of health in determining PC hospitalization outcomes in a temporal context.[9] Furthermore, to our knowledge, no prior state-level study has applied a multilevel mixed-effects framework to model patient-, hospital-, and county-level predictors of both LOS and in-hospital mortality simultaneously in a PC-specific sample, leaving the relative contribution of each level undefined.
While overall survival for PC remains poor, understanding modifiable factors associated with LOS and in-hospital mortality remains clinically important. Shorter hospital stays with equivalent outcomes reflect more efficient care delivery and reduced patient burden, while in-hospital mortality represents potentially preventable deaths during acute care episodes that may be amenable to system-level interventions.[12] Furthermore, there is no clear evidence on the temporal change in hospital outcome patterns.[12] We hypothesized that hospital structural characteristics, particularly size and teaching status, would demonstrate volume-outcome relationships, while patient-level social determinants, including race/ethnicity and insurance status, would reveal persistent disparities in acute care outcomes. Therefore, this study addressed current literature gaps by investigating the temporal trends in PC hospital admissions, LOS, and in-hospital mortality in Florida from 2010 to 2020, examining patient, hospital, and county-level predictors of these outcomes.
2.methods
2.1Data source
A retrospective cross-sectional analysis was conducted by merging data from three comprehensive sources: the Florida Agency for Health Care Administration’s (AHCA), the American Hospital Association (AHA) Annual Survey, and the Area Health Resource Files (AHRF) from 2010 to 2020. The AHCA dataset contains administrative records of over 13 million inpatient hospital discharges from 147 hospitals and collects patient-level discharge data. The AHA Annual Survey is a census-based survey administered to over 6,000 hospitals in the United States and its territories that historically has consistently achieved an over 70% response rate. The survey contains comprehensive information about hospitals’ structure, process, and performance outcomes. Lastly, the AHRF is a comprehensive database that collects county information from over 50 sources on health care professions, health facilities, population characteristics, and hospital utilization. Hospitals’ Centers for Medicare and Medicaid Services (CMS) Certification Number (CCN) and the county’s Federal Information Processing System (FIPS) codes were used to link and merge the three datasets.
2.2Participants
Adult patients aged 18 years or older with a primary diagnosis of pancreatic cancer were identified using the International Classification of Diseases (ICD) codes. For encounters before October 1, 2015, ICD-9 codes were used,[13] and for encounters after October 2015, ICD-10 codes were used (see Table 1).[14] A total of 105 patients were removed for having a missing hospital CCN. A total of 117,278 patients were identified.
| ICD-9 | ICD-10 | ||
|---|---|---|---|
| Code | Description | Code | Description |
| 157 | Malignant neoplasm of pancreas | C25.0 | Malignant neoplasm of head of pancreas |
| 157.0 | Malignant neoplasm of head of pancreas | C25.1 | Malignant neoplasm of body of pancreas |
| 157.1 | Malignant neoplasm of body of pancreas | C25.2 | Malignant neoplasm of tail of pancreas |
| 157.2 | Malignant neoplasm of tail of pancreas | C25.3 | Malignant neoplasm of pancreatic duct |
| 157.3 | Malignant neoplasm of pancreatic duct | C25.4 | Malignant neoplasm of endocrine pancreas |
| 157.4 | Malignant neoplasm of islets of Langerhans | C25.7 | Malignant neoplasm of other parts of pancreas |
| 157.8 | Malignant neoplasm of other specified sites of pancreas | C25.8 | Malignant neoplasm of overlapping sites of pancreas |
| 157.9 | Malignant neoplasm of pancreas, part unspecified | C25.9 | Malignant neoplasm of pancreas, unspecified |
| V10.09 | Personal history of malignant neoplasm of other sites in gastrointestinal tract (includes pancreas) | Z85.07 | Personal history of malignant neoplasm of pancreas |
| 230.9 | Carcinoma in situ of other and unspecified digestive organs | D01.7 | Carcinoma in situ of other specified digestive organs |
2.3Measures
We examined the relationship between patient-, hospital-, and county-characteristics and pancreatic cancer patients’ hospital LOS and in-hospital mortality. These outcomes were selected because they represent measurable indicators of acute care quality that may be amenable to system-level intervention, even in a disease with a poor long-term prognosis. LOS serves as a proxy for care efficiency and resource utilization,[15] with prolonged stays potentially reflecting complications, care coordination challenges, or disparities in access to post-acute services. In-hospital mortality captures deaths during the acute care episode that may be influenced by hospital structural factors and patient access to timely, appropriate care.[16] Our primary outcomes were LOS, measured as the total number of days from admission to discharge,[9] and in-hospital mortality, defined as death during the index hospitalization (yes/no).[17]
Patient-level variables included in the study were demographic characteristics (age and sex), social determinants of health (insurance status, race/ethnicity, and rural-urban classification),[18] and clinical factors (Elixhauser Comorbidity Index and admission type).[19] Hospital characteristics included in the study were teaching status (yes/no), bed size, rural-urban classification, ownership (government, for-profit, and not-for-profit), and part of a system. The study also included county characteristics, which included market competition and AHCA regions, to account for regional differences in care delivery and outcomes. In this study, the market competition was operationalized using the Herfindahl-Hirschman Index (HHI), whereby an HHI of 1 depicts a monopoly, and 0 is a perfectly competitive market.[11]
2.4Statistical analysis
Statistical analysis began with descriptive statistics to summarize patient, hospital, and county characteristics. In this study, cases with missing key variables or implausible values were excluded. Univariate analyses examined associations between independent variables and outcomes using
2.5Ethical considerations
This study was declared “not research involving human subjects” by the University Institutional Review Board (IRB) based on the definitions provided in the U.S. Department of Health and Human Services Code of Federal Regulations found at 45 CFR 46.102. Accordingly, this project qualified for a Waiver of IRB Review. The waiver did not absolve the researchers from complying with other federal, state, or local laws or institutional policies and procedures that are applicable in the conduct of this project.
3.results
3.1Trends in admission diagnoses
Analysis of admission diagnoses from 2010 to 2020 revealed significant temporal trends and coding transitions. Abdominal pain is the leading diagnosis throughout the decade, accounting for almost 12% of admissions in 2016 before declining to 8.5% by 2020 (see Figure 1). PC, which remained the second most common diagnosis throughout the study period, showed a significant upward trend, increasing from 4.68% in 2010 to 7.09% in 2020 (
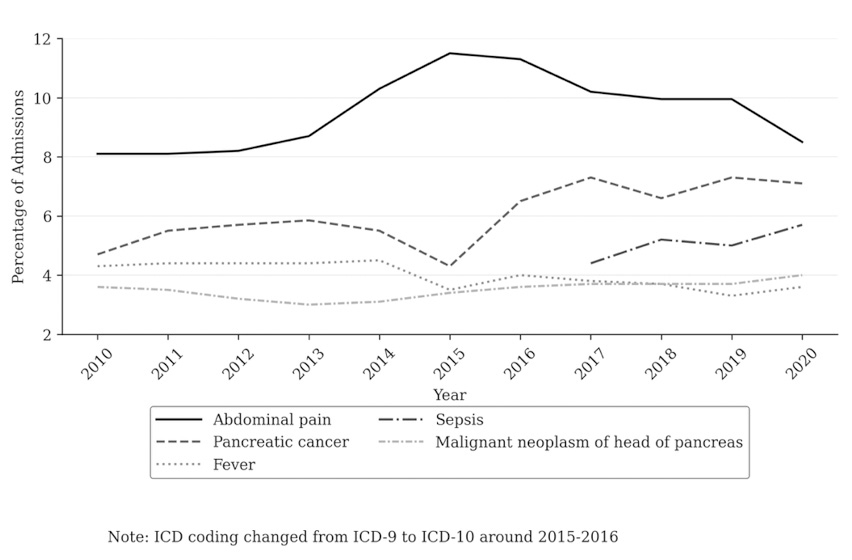
Figure 1.
Top 5 diagnosis trends over time (2010-2020)
3.2Patient and hospital characteristics
Analysis of patient and hospital characteristics from 2010 to 2020 demonstrated several trends (see Table 2). Mean patient age increased steadily from 68.75 (SD = 12.81) to 70.99 (SD = 33.92) years. Racial/ethnic composition analysis showed White patients constituted the majority (69.71% overall) but decreased from 72.4% to 68.14%. Hispanic representation increased significantly (12.88% to 14.84%), while Black patient proportion remained stable with an average of 12.31%. Length of stay decreased slightly from 6.89 (SD = 7.47) to 5.9 (SD = 6.11) days, though variation remained high. Even though the Elixhauser Comorbidity Index showed an increase from 4.22 (SD = 2.06) to 5.08 (SD = 2.21), inpatient mortality remained stable throughout the period, averaging 5.13%. Insurance coverage patterns revealed a shift toward federal insurance such as Medicare, Medicare Managed care, Tricare, and VA (increasing from 64.86% to 70.32%), while uninsured rates decreased (3.11% to 2.14%). Private insurance demonstrated a steady decline from 21.09% to 18.87%.
| Sex | ||
| Male | 58,756 | 52.79 |
| Female | 52,535 | 47.21 |
| Insurance Type | ||
| Uninsured | 2,682 | 2.41 |
| State insurance | 9,667 | 8.69 |
| Federal | 76,207 | 68.48 |
| Private | 21,811 | 19.6 |
| Other | 924 | 0.83 |
| Race/Ethnicity | ||
| White | 77,579 | 69.71 |
| Black | 13,704 | 12.31 |
| Hispanic | 16,274 | 14.62 |
| Other | 3,734 | 3.36 |
| Admission Priority | ||
| Emergency | 78,289 | 70.35 |
| Urgent | 15,181 | 13.64 |
| Elective | 17,595 | 15.81 |
| Trauma | 226 | 0.2 |
| In-hospital Mortality | ||
| No | 105,582 | 94.87 |
| Yes | 5,709 | 5.13 |
| Hospital Teaching Status | ||
| Not Teaching | 21,737 | 19.53 |
| Minor Teaching | 68,150 | 61.24 |
| Major Teaching | 21,404 | 19.23 |
| Hospital Location | ||
| Urban | 109,649 | 98.52 |
| Rural | 1,642 | 1.48 |
| Hospital Ownership Status | ||
| Government | 14,554 | 13.08 |
| For-Profit | 29,776 | 26.76 |
| Not-For-Profit | 66,961 | 60.17 |
| Hospital Part of a system | ||
| No | 16,543 | 14.86 |
| Yes | 94,748 | 85.14 |
| Age | 69.20 | 17.51 |
| Length of Stay | 6.36 | 6.85 |
| Elixhauser Comorbidity Index | 4.59 | 2.12 |
| Number of Hospital Beds | 623.37 | 649.76 |
| Hospital Medicare Percentage | 50.40 | 12.80 |
| Hospital Medicaid Percentage | 18.16 | 8.27 |
| Hospital Herfindahl–Hirschman Index | 0.25 | 0.22 |
When examining hospital characteristics, there was a growth in bed capacity, with mean beds increasing from 563.31 (SD = 517.46) to 600.32 (SD = 582.34). Medicare percentage (proportion of total Medicare inpatient days) remained relatively stable (mean = 50.32%, SD = 13.21%) while Medicaid percentage (proportion of total Medicaid inpatient visits) showed a small decline from 18.74% to 17.58%. The Herfindahl-Hirschman Index, measuring market concentration, increased from 0.14 (SD = 0.2) in 2010 to 0.28 (SD = 0.22) by 2020, indicating market consolidation. Lastly, ownership patterns showed slight shifts toward not-for-profit status (57.84% to 60.76%), while for-profit ownership decreased (28.21% to 25.97%).
3.3Predictors of length of stay
The comprehensive regression model (see Table 3) analyzing patient, hospital, and county characteristics as predictors of average length of hospital stay showed that several patient-level factors were significantly associated with longer hospital stays. Compared to emergency admission priority, elective admissions were associated with longer stays (Coefficient = 1.93,
| Length of Life | -0.09 | 0.05 | .049 | (-0.19, -0.00) |
| Quality of Life | -0.09 | 0.03 | .002 | (-0.16, -0.04) |
| Health Behaviors | 0.14 | 0.05 | .002 | (0.05, 0.24) |
| Clinical Care | -0.18 | 0.04 | < .001 | (-0.26, -0.11) |
| Social Economic Factors | 0.22 | 0.04 | < .001 | (0.15, 0.30) |
| Physical Environment | -0.06 | 0.02 | .010 | (-0.11, -0.02) |
| Herfindahl–Hirschman Index | -0.60 | 0.19 | .002 | (-0.97, -0.23) |
| Hospital Bed Size | 0.03 | 0.09 | .727 | (-0.15, 0.21) |
| Location (Ref: Urban) | ||||
| Rural | 0.28 | 0.28 | .313 | (-0.26, 0.82) |
| Rural × Bed Size (interaction) | 0.03 | 0.39 | .943 | (-0.73, 0.79) |
| Teaching status (Ref: Non-teaching) | ||||
| Minor Teaching | -2.31 | 0.68 | .001 | (-3.65, -0.97) |
| Major Teaching | -1.10 | 1.59 | .491 | (-4.22, 2.03) |
| Part of a System (Ref: No) | ||||
| Yes | -0.80 | 1.03 | .439 | (-2.82, 1.23) |
| Ownership (Ref: Government) | ||||
| For-Profit | 3.01 | 1.12 | .008 | (0.81, 5.21) |
| Not-For-Profit | 0.24 | 1.12 | .829 | (-1.95, 2.43) |
| Age | -0.01 | 0.00 | < .001 | (-0.01, -0.01) |
| Elixhauser Comorbidity Index | 0.78 | 0.01 | < .001 | (0.76, 0.80) |
| Sex (Ref: Male) | ||||
| Female | 0.19 | 0.04 | < .001 | (0.11, 0.26) |
| Race/Ethnicity (Ref: Non-Hispanic White) | ||||
| Black | 0.40 | 0.06 | < .001 | (0.28, 0.53) |
| Hispanic | -0.08 | 0.07 | .229 | (-0.22, 0.05) |
| Other | 0.29 | 0.11 | .009 | (0.07, 0.51) |
| Insurance Type (Ref: Uninsured) | ||||
| State insurance | 0.01 | 0.15 | .928 | (-0.27, 0.30) |
| Federal | -0.69 | 0.13 | < .001 | (-0.95, -0.43) |
| Private | -0.39 | 0.14 | .004 | (-0.66, -0.12) |
| Other | -3.45 | 0.25 | < .001 | (-3.95, -2.95) |
| Admission Priority (Ref: Emergency) | ||||
| Urgent | 0.90 | 0.07 | < .001 | (0.77, 1.03) |
| Elective | 1.93 | 0.06 | < .001 | (1.81, 2.04) |
| Trauma | 1.74 | 0.44 | < .001 | (0.87, 2.61) |
Federal, private, and other insurance types versus the uninsured were significantly linked to shorter stays. Among hospital characteristics, For-profit ownership compared to government ownership was associated with longer stays (Coefficient = 3.01,
County-level social determinants, entered as standardized variables (
3.4Predictors of in-hospital mortality
The comprehensive logistic regression model (see Table 4) showed that Social Economic Factors demonstrate a significant association with in-hospital mortality (OR = 1.06, 95% CI: 1.01-1.12,
| Length of Life | 0.94 | 0.03 | .0860 | (0.88, 1.01) |
| Quality of Life | 1.01 | 0.02 | .5370 | (0.98, 1.04) |
| Health Behaviors | 1.01 | 0.04 | .7920 | (0.94, 1.09) |
| Clinical Care | 1.03 | 0.03 | .3470 | (0.97, 1.10) |
| Social Economic Factors | 1.06 | 0.03 | .0270 | (1.01, 1.12) |
| Physical Environment | 1.00 | 0.00 | .9880 | (1.00, 1.00) |
| Herfindahl–Hirschman Index | 0.76 | 0.09 | .0170 | (0.61, 0.95) |
| Hospital Bed Size | 1.02 | 0.05 | .6560 | (0.93, 1.11) |
| Location (Ref: Urban) | ||||
| Rural | 2.37 | 0.83 | .0140 | (1.19, 4.72) |
| Rural × Bed Size (interaction) | 0.73 | 0.14 | .1110 | (0.49, 1.08) |
| Teaching status (Ref: Non-teaching) | ||||
| Minor Teaching | 0.83 | 0.06 | .0090 | (0.72, 0.96) |
| Major Teaching | 0.76 | 0.10 | .0400 | (0.59, 0.99) |
| Part of a System (Ref: No) | ||||
| Yes | 1.11 | 0.11 | .3240 | (0.90, 1.36) |
| Ownership (Ref: Government) | ||||
| For-Profit | 1.27 | 0.15 | .0380 | (1.01, 1.59) |
| Not-For-Profit | 0.95 | 0.11 | .6620 | (0.76, 1.19) |
| Age | 1.00 | 0.00 | .0020 | (1.00, 1.00) |
| Elixhauser Comorbidity Index | 1.30 | 0.01 | .0000 | (1.28, 1.31) |
| Sex (Ref: Male) | ||||
| Female | 0.83 | 0.02 | .0000 | (0.79, 0.88) |
| Race/Ethnicity (Ref: Non-Hispanic White) | ||||
| Black | 1.18 | 0.05 | .0000 | (1.08, 1.28) |
| Hispanic | 1.05 | 0.05 | .2470 | (0.96, 1.16) |
| Other | 1.27 | 0.10 | .0020 | (1.09, 1.47) |
| Insurance Type (Ref: Uninsured) | ||||
| State insurance | 0.82 | 0.08 | .0570 | (0.67, 1.01) |
| Federal | 0.70 | 0.07 | .0000 | (0.59, 0.85) |
| Private | 0.87 | 0.08 | .1640 | (0.72, 1.06) |
| Other | 7.71 | 0.93 | .0000 | (6.12, 9.8) |
| Admission Priority (Ref: Emergency) | ||||
| Urgent | 1.33 | 0.06 | .0000 | (1.21, 1.45) |
| Elective | 1.14 | 0.05 | .0030 | (1.03, 1.22) |
| Trauma | 2.25 | 0.56 | .0010 | (1.36, 3.64) |
The Elixhauser Comorbidity Index is a predictor (OR = 1.30, 95% CI: 1.28-1.31,
4.discussion
The significant increase in pancreatic cancer as a primary admission diagnosis parallels national trends documented in previous studies. This trend parallels national data reported by Bhandari, Abdul [21] and Dahiya, Inamdar [9] suggesting systemic factors driving increased healthcare utilization for pancreatic cancer patients, consistent with national data. The magnitude of this increase cannot be attributed solely to population aging: the data demonstrate concurrent increases in comorbidity burden as measured by the Elixhauser Index, indicating more medically complex patients presenting for care. These trends directly address the study’s first objective and establish the epidemiological context in which hospital and patient-level predictors operate.
The emergence of sepsis as a leading diagnosis after 2017 merits particular attention from a clinical standpoint. This pattern may reflect enhanced sepsis recognition following implementation of Sepsis-3 criteria and systematic screening protocols, or may indicate genuine changes in disease presentation or complications.[22, 23] From a gastroenterological perspective, this trend warrants investigation of potential relationships with interventional procedures, biliary obstruction management, or immunocompromised states associated with chemotherapy regimens.
Addressing the study’s temporal trend objective for in-hospital mortality, the data show stable rates over a decade despite a significant increase in patient complexity. Mean patient age and the Elixhauser Comorbidity Index both rose, indicating that hospitals were treating older and sicker patients. Maintaining stable mortality in this context is significant: it suggests that advances in perioperative care, critical care management, and complication response have offset the expected rise in mortality driven by patient acuity. This finding is clinically meaningful because it reframes stable mortality not as stagnation but as a quality achievement against a deteriorating case-mix baseline.[24] Addressing the LOS objective directly, the data show a modest but significant reduction in LOS over the study period. This gain was achieved despite rising comorbidity burden and likely reflects improvements in care coordination, including the implementation of enhanced recovery after surgery (ERAS) protocols that have demonstrated effectiveness in major pancreatic surgeries.[25] The significance of this finding extends beyond efficiency: shorter stays with stable mortality indicate improved care value, not simply cost compression. However, this analysis does not capture post-discharge outcomes, and the clinical implications of shorter stays must be weighed against potential readmission risk.
The observed racial disparities in mortality outcomes confirm the study’s hypothesis that patient-level social determinants reveal persistent disparities in acute care outcomes. Black patients faced 18% higher in-hospital mortality odds compared to Non-Hispanic White patients, a finding that persisted after adjusting for age, comorbidity, insurance status, and hospital characteristics. The significance of this finding lies in its magnitude and its resistance to risk adjustment: the disparity cannot be explained by the clinical factors measured, implicating structural barriers including differential access to subspecialty care, implicit bias in clinical decision-making, and unequal utilization of palliative resources. These findings align with established literature demonstrating reduced access to care, delayed diagnosis, and differential treatment patterns for racial minorities with pancreatic cancer.[26,27,28]
The insurance-related findings address the hypothesis regarding patient-level predictors and extend it to the domain of financial access. Federal insurance coverage—primarily Medicare—is associated with 30% lower odds of in-hospital mortality (OR = 0.70,
Rural location is associated with substantially elevated in-hospital mortality (OR = 2.37, CI: 1.19–4.72,
This analysis of county-level social determinants revealed the complex relationship between population health factors and individual clinical outcomes. The significant association between Social Economic Factors and mortality, while modest in magnitude, suggests that upstream interventions addressing community-level socioeconomic conditions may yield downstream benefits for cancer patients.[34] This finding supports the growing recognition that healthcare quality cannot be divorced from broader social and economic conditions. The lack of association between most county-level health measures and acute care outcomes may reflect the temporal disconnect between long-term population health factors and immediate hospitalization outcomes. These factors likely exert greater influence on cancer prevention, early detection, and long-term survival rather than acute care mortality. The relatively homogeneous socioeconomic landscape within Florida may also limit the detectability of these relationships compared to more geographically diverse populations.[35]
Study limitations
This study is limited by the data source and data points available. First, the administrative dataset used for this analysis is limited to hospital encounters and does not account for events outside of the encounter. Second, the administrative data lacks granular clinical details on disease stage, functional status, and the treatment decision that may significantly impact PC outcomes. The absence of staging information limits the interpretation of the disparities found in the study. Third, the study focuses on in-hospital outcomes and does not capture any long-term outcomes. Finally, the findings from this study provide state-specific insights; it limits the study findings’ generalizability to similar regions and States. Even with these limitations, the findings from this study have important healthcare policy implications. This study sets the foundation that will allow future research to explore the granular clinical outcomes of social determinants of health.
5.conclusions
This study examined trends in PC hospital admissions, LOS, and in-hospital mortality, and the study findings have direct implications for patient care. First, the persistent racial disparities in mortality outcomes signal the need for targeted screening and early intervention programs in underserved communities. Reducing time to diagnosis and ensuring equitable access to specialized care could improve survival for Black patients and other at-risk populations. Second, the strong volume-outcome relationship supports continued regionalization of PC care. Patients may benefit from referral to high-volume centers for complex procedures, though healthcare systems must balance centralization with geographic access. Third, the protective effect of federal insurance suggests that coverage expansion could improve outcomes for uninsured patients. Policymakers should consider these findings when designing programs to reduce financial barriers to cancer care. Lastly, the stable mortality rates despite increasing patient complexity indicate that advances in perioperative and critical care management have been effective. Hospitals should continue implementing enhanced recovery protocols and evidence-based complication management. Addressing these modifiable factors through policy interventions, care coordination, and targeted outreach programs may lead to a reduction in preventable deaths and improve the quality of life for PC patients.
Authors contributions
H.Y.H.: Conception, analyzing data, and design; drafting the article; final approval of the version to be published. Y.B.: Editing the article and revising it critically for important intellectual content; final approval of the version to be published.
Funding
No funding.
Conflicts of Interest Disclosure
The authors declare they have no conflicts of interest.
Informed consent
Not applicable.
Ethics approval
The Publication Ethics Committee of the Association for Health Sciences and Education. The journal’s policies adhere to the Core Practices established by the Committee on Publication Ethics (COPE).
Provenance and peer review
Not commissioned; externally double-blind peer reviewed.
Data availability statement
The data that support the findings of this study are not publicly available due to privacy or ethical restrictions.
Data sharing statement
No additional data are available.
Acknowledgements
None.
References
- Miller K, Siegel R, Lin C. Cancer treatment and survivorship statistics, 2016. CA Cancer J Clin. 2016;66(4):271-89. doi:10.3322/caac.21349
- Park W, Chawla A, O’Reilly E. Pancreatic cancer: a review. JAMA. 2021;326(9):851-62. doi:10.1001/jama.2021.13027
- Wegner R, Verma V, Hasan S. Incidence and risk factors for post-operative mortality, hospitalization, and readmission rates following pancreatic cancer resection. J Gastrointest Oncol. 2019;10(6):1080-93. doi:10.21037/jgo.2019.09.01
- Permuth J, Clark Daly A, Jeong D. Racial and ethnic disparities in a state-wide registry of patients with pancreatic cancer and an exploratory investigation of cancer cachexia as a contributor to observed inequities. Cancer Med. 2019;8(6):3314-24. doi:10.1002/cam4.2180
- Cancer Epidemiology, Biomarkers & Prevention. Edited by Telisnor G, Lim A, Zhang Z. American Association for Cancer Research. 2023. doi:10.1158/1538-7755.DISP22-A076
- Jimenez P, Popp R, Sharan S. Sociodemographic barriers to the timely treatment of pancreatic cancer. Anticancer Res. 2023;43(11):4969-74. doi:10.21873/anticanres.16695
- Fuko C, Magacha H, Noah G. Ethnic/racial disparities in pancreatic cancer mortality across the United States: A national inpatient sample database analysis. Cureus. 2025;17(1):e77389. doi:10.7759/cureus.77389
- Munir M, Woldesenbet S, Endo Y. Variation in hospital mortality after complex cancer surgery: Patient, volume, hospital or social determinants. Ann Surg Oncol. 2024;31(5):2856-66. doi:10.1245/s10434-023-14852-y
- Dahiya D, Inamdar S, Perisetti A. Decreasing length of stay and inpatient mortality associated with pancreatic cancer hospitalizations: A United States national survey from 2008 to 2017. Pancreatology. 2022;22(5):590-7. doi:10.1016/j.pan.2022.04.008
- Ang D, Sugimoto J, Richards W. Hospital volume of emergency general surgery and its impact on inpatient mortality for geriatric patients: Analysis from 3994 hospitals. Am Surg. 2023;89(4):996-1002. doi:10.1177/00031348211049251
- Munir M, Woldesenbet S, Endo Y. Association of hospital market competition with outcomes of complex cancer surgery. Ann Surg Oncol. 2024;31(7):4371-80. doi:10.1245/s10434-024-15278-w
- Stone K, Zwiggelaar R, Jones P. A systematic review of the prediction of hospital length of stay: Towards a unified framework. PLOS Digit Health. 2022;1(4):e0000017. doi:10.1371/journal.pdig.0000017
- Munigala S, Subramaniam D, Subramaniam D. Incidence and risk of pancreatic cancer in patients with a new diagnosis of chronic pancreatitis. Dig Dis Sci. 2022;67(2):708-15. doi:10.1007/s10620-021-06886-7
- Nguyen A, Torabi Sagvand B, Alizadeh M. Primary sclerosing cholangitis and pancreatic cancer: A retrospective cohort study of United States veterans. Front Gastroenterol. 2023;1:1076788. doi:10.3389/fgstr.2022.1076788
- Hirani R, Podder D, Stala O. Strategies to reduce hospital length of stay: Evidence and challenges. Medicina (Kaunas). 2025;61(5):922. doi:10.3390/medicina61050922
- Porcel-Galvez A, Barrientos-Trigo S, Gil-Garcia E. Factors associated with in-hospital mortality in acute care hospital settings: A prospective observational study. Int J Environ Res Public Health. 2020;17(21):7951. doi:10.3390/ijerph17217951
- Lingsma H, Bottle A, Middleton S. Evaluation of hospital outcomes: the relation between length-of-stay, readmission, and mortality in a large international administrative database. BMC Health Serv Res. 2018;18(1):116. doi:10.1186/s12913-018-2916-1
- Afshar N, English D, Milne R. Factors explaining socio-economic inequalities in cancer survival: A systematic review. 2021;28:10732748211011956. doi:10.1177/10732748211011956
- Hamadi H, Wadei H, Xu J. Impact of change in allocation score methodology on post kidney transplant average length of stay. J Clin Med Res. 2022;14(3):111-8. doi:10.14740/jocmr4673
- StataCorp LLC. Stata Statistical Software: Release 17. College Station, TX; StataCorp LLC. 2021.
- Bhandari S, Abdul M, Hollabaugh W. Decreased trend in hospital mortality from pancreatic cancer despite increase in number of hospital admissions. PLoS One. 2018;13(7):e0199909. doi:10.1371/journal.pone.0199909
- Marin A, Sanchuki H, Namur G. Circulating cell-free nucleic acids as biomarkers for diagnosis and prognosis of pancreatic cancer. Biomedicines. 2023;11(4):1069. doi:10.3390/biomedicines11041069
- Pavlidis E, Galanis I, Pavlidis T. Updates in the diagnosis and management of ductal adenocarcinoma of the pancreas. World J Clin Oncol. 2025;16(6):105601. doi:10.5306/wjco.v16.i6.105601
- Winter J, Cameron J, Campbell K. 1423 pancreaticoduodenectomies for pancreatic cancer: A single-institution experience. J Gastrointest Surg. 2006;10(9):1199-210. discussion 210-1 doi:10.1016/j.gassur.2006.08.018
- Ellwanger M, Ellwanger M, Jardine M. Effectiveness of enhanced recovery after surgery protocol in pancreatic surgery: A systematic review and meta-analysis of randomized controlled trials. J Gastrointest Surg. 2025;29(3):101939. doi:10.1016/j.gassur.2024.101939
- Forsmark C, Vege S, Wilcox C. Acute Pancreatitis. N Engl J Med. 2016;375(20):1972-81. doi:10.1056/NEJMra1505202
- Wang Y, Schrag D, Brooks G. National trends in pancreatic cancer outcomes and pattern of care among Medicare beneficiaries, 2000 through 2010. Cancer. 2014;120(7):1050-8. doi:10.1002/cncr.28537
- Bliton J, Parides M, Muscarella P. Understanding Racial Disparities in Gastrointestinal Cancer Outcomes: Lack of Surgery Contributes to Lower Survival in African American Patients. Cancer Epidemiol Biomarkers Prev. 2021;30(3):529-38. doi:10.1158/1055-9965.EPI-20-0950
- Atodaria K, Cohen S, Dhruv S. Trends in palliative care, hospice utilization, and outcomes in hospitalized pancreatic cancer patients: a nationwide analysis. Cureus. 2022;14(9):e29351. doi:10.7759/cureus.29351
- Yabroff K, Reeder-Hayes K, Zhao J. Health insurance coverage disruptions and cancer care and outcomes: systematic review of published research. J Natl Cancer Inst. 2020;112(7):671-87. doi:10.1093/jnci/djaa048
- Han X, Yabroff K, Brawley W. Comparison of insurance status and diagnosis stage among patients with newly diagnosed cancer before vs after implementation of the Patient Protection and Affordable Care Act. JAMA Oncol. 2018;4(12):1713-1720. doi:10.1001/jamaoncol.2018.3467
- Silvestri G, Jemal A, Yabroff K. Cancer outcomes among medicare beneficiaries and their younger uninsured counterparts. Health Aff (Millwood). 2021;40(5):754-62. doi:10.1377/hlthaff.2020.01839
- Amin K, Khan H, Hearld L. Association between rural residence and processes of care in pancreatic cancer treatment. J Gastrointest Surg. 2023;27(10):2155-65. doi:10.1007/s11605-023-05764-z
- Finlayson E, Goodney P, Birkmeyer J. Hospital volume and operative mortality in cancer surgery: a national study. Arch Surg. 2003;138(7):721-5. discussion 6 doi:10.1001/archsurg.138.7.721
- Eskander M, Hamad A, Li Y. From street address to survival: Neighborhood socioeconomic status and pancreatic cancer outcomes. Surgery. 2022;171(3):770-6. doi:10.1016/j.surg.2021.10.027
 This work is licensed under a